The TMS Flash Arrows (Non-Repaint) is a trading indicator designed to assist in identifying potential market opportunities. It integrates several analytical methods to provide visual signals on a trading chart. The indicator combines elements such as RSI, volatility bands, and TDI lines, along with Heiken Ashi candles, to generate trading arrows. These arrows help highlight possible buy or sell points based on the interaction of these components.
#property indicator_buffers 8
#property indicator_chart_window
// External parameters for customization
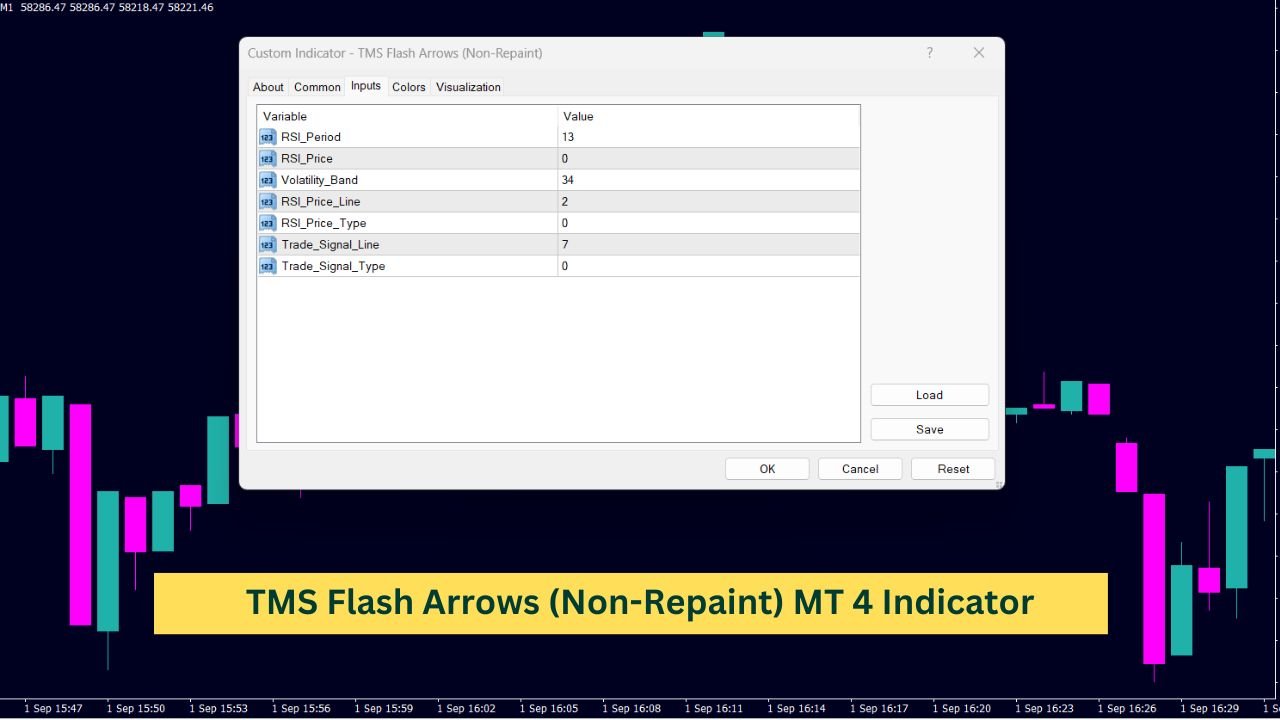
extern int RSI_Period = 13; // RSI Period (8-25)
extern int RSI_Price = 0; // RSI Price (0-6)
extern int Volatility_Band = 34; // Volatility Band (20-40)
extern int RSI_Price_Line = 2; // RSI Price Line
extern int RSI_Price_Type = 0; // RSI Price Type (0-3)
extern int Trade_Signal_Line = 7; // Trade Signal Line
extern int Trade_Signal_Type = 0; // Trade Signal Type (0-3)
// Buffers for storing indicator values
double RSIBuf[], UpZone[], MdZone[], DnZone[], MaBuf[], MbBuf[], TMS_Up[], TMS_Dn[];
datetime LastAlert;
//+------------------------------------------------------------------+
//| Initialization function |
//+------------------------------------------------------------------+
int OnInit()
{
// Indicator name
IndicatorShortName("TMS");
// Set buffers
SetIndexBuffer(0, RSIBuf);
SetIndexBuffer(1, UpZone);
SetIndexBuffer(2, MdZone);
SetIndexBuffer(3, DnZone);
SetIndexBuffer(4, MaBuf); // TDI Green
SetIndexBuffer(5, MbBuf); // TDI Red
SetIndexBuffer(6, TMS_Up);
SetIndexBuffer(7, TMS_Dn);
// Set styles for indicators
SetIndexStyle(0, DRAW_NONE);
SetIndexStyle(1, DRAW_NONE);
SetIndexStyle(2, DRAW_NONE);
SetIndexStyle(3, DRAW_NONE);
SetIndexStyle(4, DRAW_NONE);
SetIndexStyle(5, DRAW_NONE);
SetIndexStyle(6, DRAW_ARROW, STYLE_SOLID, 1, clrLime);
SetIndexArrow(6, 233);
SetIndexStyle(7, DRAW_ARROW, STYLE_SOLID, 1, clrRed);
SetIndexArrow(7, 234);
// Set labels for arrows
SetIndexLabel(6, "TMS Bullish");
SetIndexLabel(7, "TMS Bearish");
return(INIT_SUCCEEDED);
}
//+------------------------------------------------------------------+
//| Main function |
//+------------------------------------------------------------------+
int OnCalculate(const int rates_total, const int prev_calculated, datetime &time[])
{
double MA, RSI[];
ArrayResize(RSI, Volatility_Band);
int counted_bars = IndicatorCounted();
int limit = rates_total - counted_bars - 1;
// Calculate RSI and zones
for(int i = limit; i >= 0; i--)
{
RSIBuf[i] = iRSI(NULL, 0, RSI_Period, RSI_Price, i);
MA = 0;
for(int x = i; x < i + Volatility_Band; x++)
{
RSI[x - i] = RSIBuf[x];
MA += RSIBuf[x] / Volatility_Band;
}
UpZone[i] = MA + (1.6185 * StDev(RSI, Volatility_Band));
DnZone[i] = MA - (1.6185 * StDev(RSI, Volatility_Band));
MdZone[i] = (UpZone[i] + DnZone[i]) / 2;
}
// Calculate TDI lines
for (int i = limit - 1; i >= 0; i--)
{
MaBuf[i] = iMAOnArray(RSIBuf, 0, RSI_Price_Line, 0, RSI_Price_Type, i);
MbBuf[i] = iMAOnArray(RSIBuf, 0, Trade_Signal_Line, 0, Trade_Signal_Type, i);
}
// Generate TMS signals
for (int i = limit - 1; i >= 0; i--)
{
// Bullish signal conditions
if ( MaBuf[i] > MbBuf[i] && MaBuf[i + 1] < MbBuf[i + 1] // TDI bullish cross
&& iStochastic(NULL, 0, 8, 3, 3, MODE_SMA, 0, MODE_MAIN, i) > iStochastic(NULL, 0, 8, 3, 3, MODE_SMA, 0, MODE_SIGNAL, i) // Stochastic upwards
&& iCustom(NULL, 0, "Heiken Ashi", clrRed, clrWhite, clrRed, clrWhite, 2, i) < iCustom(NULL, 0, "Heiken Ashi", clrRed, clrWhite, clrRed, clrWhite, 3, i) // Heiken Ashi open > close
&& ( iCustom(NULL, 0, "Heiken Ashi", clrRed, clrWhite, clrRed, clrWhite, 2, i + 1) > iCustom(NULL, 0, "Heiken Ashi", clrRed, clrWhite, clrRed, clrWhite, 3, i + 1) // First candle bullish
|| ( iCustom(NULL, 0, "Heiken Ashi", clrRed, clrWhite, clrRed, clrWhite, 2, i + 1) < iCustom(NULL, 0, "Heiken Ashi", clrRed, clrWhite, clrRed, clrWhite, 3, i + 1) // Second candle bullish
&& iCustom(NULL, 0, "Heiken Ashi", clrRed, clrWhite, clrRed, clrWhite, 2, i + 2) > iCustom(NULL, 0, "Heiken Ashi", clrRed, clrWhite, clrRed, clrWhite, 3, i + 2)
)
)
)
{
TMS_Up[i] = Low[i];
if (i == 0 && Time[0] > LastAlert)
{
Alert(Symbol() + "," + TFToStr(Period()) + ": TMS Bullish Signal");
LastAlert = TimeCurrent();
}
}
// Bearish signal conditions
if ( MaBuf[i] < MbBuf[i] && MaBuf[i + 1] > MbBuf[i + 1] // TDI bearish cross
&& iStochastic(NULL, 0, 8, 3, 3, MODE_SMA, 0, MODE_MAIN, i) < iStochastic(NULL, 0, 8, 3, 3, MODE_SMA, 0, MODE_SIGNAL, i) // Stochastic downwards
&& iCustom(NULL, 0, "Heiken Ashi", clrRed, clrWhite, clrRed, clrWhite, 2, i) > iCustom(NULL, 0, "Heiken Ashi", clrRed, clrWhite, clrRed, clrWhite, 3, i) // Heiken Ashi open > close
&& ( iCustom(NULL, 0, "Heiken Ashi", clrRed, clrWhite, clrRed, clrWhite, 2, i + 1) < iCustom(NULL, 0, "Heiken Ashi", clrRed, clrWhite, clrRed, clrWhite, 3, i + 1) // First candle bearish
|| ( iCustom(NULL, 0, "Heiken Ashi", clrRed, clrWhite, clrRed, clrWhite, 2, i + 1) > iCustom(NULL, 0, "Heiken Ashi", clrRed, clrWhite, clrRed, clrWhite, 3, i + 1) // Second candle bearish
&& iCustom(NULL, 0, "Heiken Ashi", clrRed, clrWhite, clrRed, clrWhite, 2, i + 2) < iCustom(NULL, 0, "Heiken Ashi", clrRed, clrWhite, clrRed, clrWhite, 3, i + 2)
)
)
)
{
TMS_Dn[i] = High[i];
if (i == 0 && Time[0] > LastAlert)
{
Alert(Symbol() + "," + TFToStr(Period()) + ": TMS Bearish Signal");
LastAlert = TimeCurrent();
}
}
}
return(rates_total);
}
//+------------------------------------------------------------------+
//| Calculate standard deviation |
//+------------------------------------------------------------------+
double StDev(double &Data[], int Per)
{
return(MathSqrt(Variance(Data, Per)));
}
//+------------------------------------------------------------------+
//| Calculate variance |
//+------------------------------------------------------------------+
double Variance(double &Data[], int Per)
{
double sum = 0, ssum = 0;
for (int i = 0; i < Per; i++)
{
sum += Data[i];
ssum += MathPow(Data[i], 2);
}
return((ssum * Per - sum * sum) / (Per * (Per - 1)));
}
//+------------------------------------------------------------------+
//| Convert timeframe to string |
//+------------------------------------------------------------------+
string TFToStr(int tf)
{
if (tf == 0) tf = Period();
if (tf >= 43200) return("MN"); // Monthly
if (tf >= 10080) return("W1"); // Weekly
if (tf >= 1440) return("D1"); // Daily
if (tf >= 240) return("H4"); // 4-hour
if (tf >= 60) return("H1"); // Hourly
if (tf >= 30) return("M30"); // 30-minute
if (tf >= 15) return("M15"); // 15-minute
if (tf >= 5) return("M5"); // 5-minute
if (tf >= 1) return("M1"); // 1-minute
return("");
}
//+------------------------------------------------------------------+
What is the TMS Indicator?
The TMS (Trend Management System) Indicator is a versatile tool designed to help traders identify potential buying and selling opportunities. It does this by analyzing different market factors and generating signals based on predefined conditions. The TMS Indicator combines several technical analysis tools to provide a comprehensive view of the market.
Key Components of the TMS Indicator
Relative Strength Index (RSI)
The Relative Strength Index (RSI) is a momentum oscillator that measures the speed and change of price movements. It is used to identify overbought or oversold conditions in a market. In the TMS Indicator, the RSI is calculated using a specific period and price type, providing a basis for other calculations.
Volatility Bands
Volatility Bands help in understanding market volatility by defining a range around the RSI. These bands consist of an upper and lower limit, calculated using the standard deviation of the RSI values. The bands help traders gauge market volatility and potential price reversals.
TDI Lines
The TDI Lines (Traders Dynamic Index) include two main lines:
- TDI Green Line: This line is derived from the RSI values and helps in identifying bullish or bearish trends.
- TDI Red Line: This line is used in conjunction with the TDI Green Line to identify potential trading signals based on their crossovers.
These lines are calculated using moving averages on the RSI values, providing a smoothed view of the trend.
Trade Signal Lines
The Trade Signal Lines are crucial for generating trading signals. They are determined by the intersection of the TDI Green and Red Lines. A crossover of these lines indicates a potential trading opportunity, with the direction of the crossover signaling whether to buy or sell.
Heiken Ashi Candles
Heiken Ashi Candles are a type of chart that smooths out price data to better identify trends. The TMS Indicator uses these candles to confirm trading signals. A bullish or bearish signal is confirmed based on the color and position of these candles.
How the TMS Indicator Works
The TMS Indicator operates by combining these components to generate buy or sell signals. Here’s a simple overview of how it works:
- Calculate RSI Values: The RSI is calculated for a specified period, and its values are used to determine market conditions.
- Determine Volatility Bands: Using the RSI values, the indicator calculates the upper and lower volatility bands. These bands help in identifying the potential reversal points.
- Compute TDI Lines: The TDI Green and Red Lines are calculated using moving averages on the RSI values. The interaction between these lines is analyzed to detect trading signals.
- Generate Trading Signals: The indicator checks for crossovers between the TDI Lines and verifies these signals using Heiken Ashi Candles. If the conditions meet the criteria, a trading signal is generated.
What to Look For
- Bullish Signals: These are indicated when the TDI Green Line crosses above the TDI Red Line, supported by an upward-moving Stochastic and a bullish Heiken Ashi Candle.
- Bearish Signals: These are indicated when the TDI Green Line crosses below the TDI Red Line, supported by a downward-moving Stochastic and a bearish Heiken Ashi Candle.
Conclusion
The TMS Indicator is a comprehensive tool that combines several technical analysis methods to provide a holistic view of market trends. By understanding the components and how they interact, traders can better interpret market conditions and make more informed decisions.
In summary, the TMS Indicator uses RSI, volatility bands, TDI lines, and Heiken Ashi candles to generate trading signals. While it provides valuable insights, it’s important to remember that no indicator is perfect, and it should be used in conjunction with other analysis methods to achieve the best results.