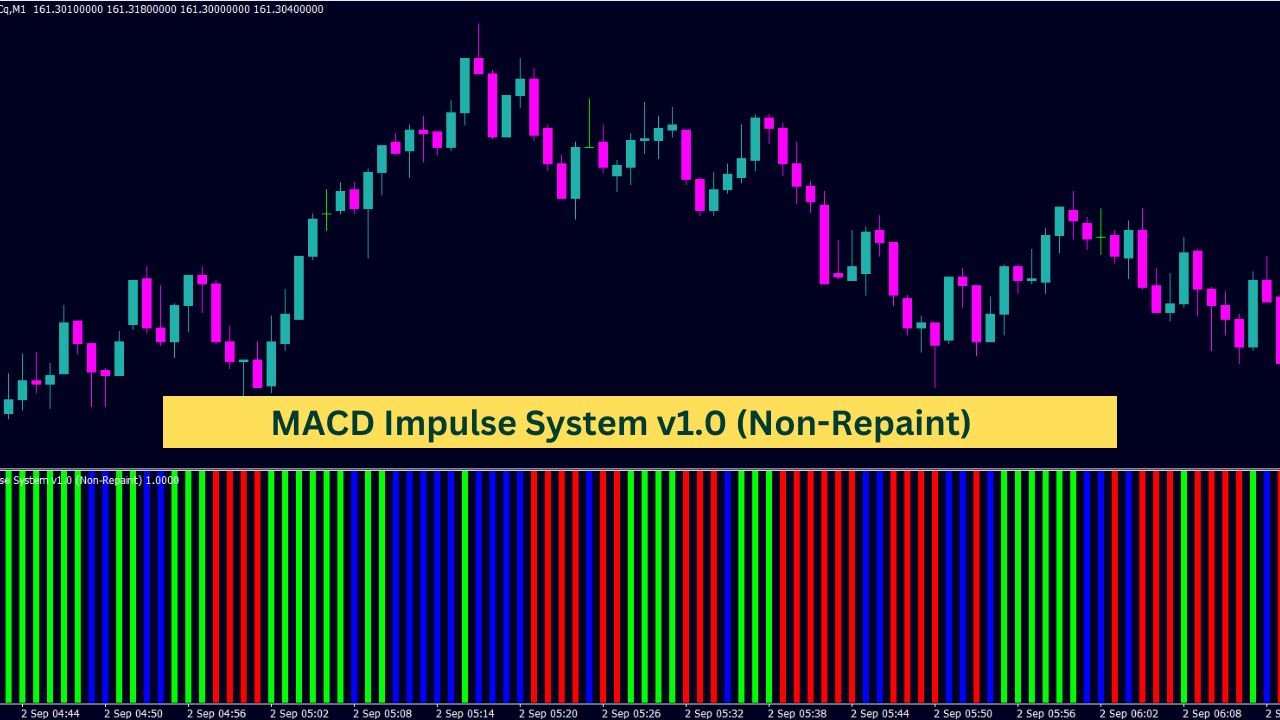
The MACD Impulse System v1.0 (Non-Repaint) is a custom indicator designed to analyze market momentum by combining two key elements: the Exponential Moving Average (EMA) and the MACD histogram. This system categorizes market movements into three distinct states—Impulse Up, Impulse Down, and Neutral—based on the interaction between these components. By providing a clear visual representation of these impulses, the indicator helps users observe and understand market dynamics more effectively.
#property indicator_separate_window
#property indicator_minimum 0
#property indicator_maximum 1
#property indicator_buffers 3
#property indicator_color1 Lime
#property indicator_color2 Blue
#property indicator_color3 Red

//---- Input parameters
extern int ShowBars = 5000;  // Number of bars to show

//---- Indicator buffers
double Impulse_Up[];
double Neutral[];
double Impulse_Down[];
double MACDLineBuffer[];
double SignalLineBuffer[];
double HistogramBuffer[];

//---- Variables
double alpha = 2.0 / (9 + 1.0);  // Alpha for MACD signal line smoothing
double alpha_1 = 1.0 - alpha;    // Complementary alpha for MACD signal line

//+------------------------------------------------------------------+
//| Custom indicator initialization function                         |
//+------------------------------------------------------------------+
int init()
  {
   //---- Initialize indicator buffers
   IndicatorBuffers(6);

   //---- Configure histogram for Impulse Up
   SetIndexStyle(0, DRAW_HISTOGRAM, STYLE_SOLID, 4);
   SetIndexEmptyValue(0, 0.0);
   SetIndexBuffer(0, Impulse_Up);

   //---- Configure histogram for Neutral
   SetIndexStyle(1, DRAW_HISTOGRAM, STYLE_SOLID, 4);
   SetIndexEmptyValue(1, 0.0);
   SetIndexBuffer(1, Neutral);

   //---- Configure histogram for Impulse Down
   SetIndexStyle(2, DRAW_HISTOGRAM, STYLE_SOLID, 4);
   SetIndexEmptyValue(2, 0.0);
   SetIndexBuffer(2, Impulse_Down);

   //---- Buffers for MACD and Signal lines
   SetIndexBuffer(3, MACDLineBuffer);
   SetIndexBuffer(4, SignalLineBuffer);
   SetIndexBuffer(5, HistogramBuffer);

   return(0);
  }

//+------------------------------------------------------------------+
//| Custom indicator deinitialization function                       |
//+------------------------------------------------------------------+
int deinit()
  {
   // No deinitialization required
   return(0);
  }

//+------------------------------------------------------------------+
//| Custom indicator iteration function                              |
//+------------------------------------------------------------------+
int start()
  {
   //---- Calculate the number of bars to process
   int limit = MathMin(ShowBars, Bars - 1);

   //---- Main calculation loop
   for(int shift = limit; shift >= 0; shift--)
     {
      //---- Calculate EMA (13)
      double myStudy1_value0 = iMA(Symbol(), 0, 13, 0, MODE_EMA, PRICE_CLOSE, shift);
      double myStudy1_value1 = iMA(Symbol(), 0, 13, 0, MODE_EMA, PRICE_CLOSE, shift + 1);

      //---- Calculate MACD line and Signal line
      MACDLineBuffer[shift] = iMA(Symbol(), 0, 12, 0, MODE_EMA, PRICE_CLOSE, shift) - iMA(Symbol(), 0, 26, 0, MODE_EMA, PRICE_CLOSE, shift);
      SignalLineBuffer[shift] = alpha * MACDLineBuffer[shift] + alpha_1 * SignalLineBuffer[shift + 1];

      //---- Determine Impulse Up, Down, or Neutral
      Impulse_Up[shift] = (myStudy1_value0 > myStudy1_value1 && MACDLineBuffer[shift] - SignalLineBuffer[shift] > MACDLineBuffer[shift + 1] - SignalLineBuffer[shift + 1]) ? 1 : 0.0;
      Impulse_Down[shift] = (myStudy1_value0 < myStudy1_value1 && MACDLineBuffer[shift] - SignalLineBuffer[shift] < MACDLineBuffer[shift + 1] - SignalLineBuffer[shift + 1]) ? 1 : 0.0;
      Neutral[shift] = (Impulse_Up[shift] == 0.0 && Impulse_Down[shift] == 0.0) ? 1 : 0.0;
     }

   return(0);
  }
//+------------------------------------------------------------------+
The Impulse Indicator is a versatile tool designed to identify trends and momentum in financial markets. This particular indicator focuses on combining two critical components: Exponential Moving Averages (EMA) and MACD (Moving Average Convergence Divergence) lines. By blending these elements, the indicator provides a clear visual representation of market impulses—whether they are upward, downward, or neutral.
How the Impulse Indicator Works
At its core, the Impulse Indicator analyzes price movements through two main components: a 13-period EMA and a MACD histogram. These two indicators work together to assess whether the market is gaining momentum in a particular direction or if it is experiencing a pause.
The EMA and Its Role
The 13-period EMA is a crucial part of this indicator. An EMA, or Exponential Moving Average, gives more weight to recent prices, making it more responsive to recent market changes than a simple moving average (SMA). In this context, the 13-period EMA is used to detect the direction of the current trend. If the EMA’s value increases compared to the previous period, it indicates a potential upward momentum. Conversely, a decreasing EMA suggests downward momentum.
The MACD Line and Signal Line Interaction
The MACD is a popular tool used in technical analysis to identify changes in the strength, direction, momentum, and duration of a trend. In the Impulse Indicator, the MACD line is calculated by subtracting the 26-period EMA from the 12-period EMA. This difference highlights the convergence or divergence between the two moving averages, hence the name “MACD.”
Alongside the MACD line, the Signal Line is plotted as an EMA of the MACD line itself. The interaction between the MACD line and the Signal Line generates the MACD histogram. When the MACD line is above the Signal Line, the histogram is positive, indicating bullish momentum. When it is below, the histogram is negative, pointing to bearish momentum.
Identifying Market Impulses
The Impulse Indicator uses the interaction between the EMA and the MACD histogram to categorize the market’s momentum into three states:
Impulse Up
An Impulse Up occurs when both the 13-period EMA and the MACD histogram are increasing. This scenario suggests that the market is gaining bullish momentum, and prices are likely to continue rising. In the visual representation, Impulse Up is typically shown in green, signaling an upward push.
Impulse Down
An Impulse Down is identified when both the 13-period EMA and the MACD histogram are decreasing. This indicates bearish momentum, meaning that prices are likely to keep falling. Impulse Down is represented in red, warning of a downward trend.
Neutral
When neither of the above conditions is met—meaning the EMA and the MACD histogram do not align in their direction—the market is considered Neutral. This state occurs when the market lacks a strong directional push. In this indicator, a Neutral state is displayed in blue, indicating a pause or indecision in the market.
Visual Representation and Buffering
To present these impulses clearly on a chart, the indicator uses three distinct buffers:
- Impulse Up Buffer: Stores data points that reflect an upward impulse.
- Impulse Down Buffer: Captures moments when the market shows a downward impulse.
- Neutral Buffer: Holds values indicating a neutral or indecisive market.
Each buffer’s values are then plotted on the chart as colored histograms, offering traders a clear visual cue about the market’s current state.
Conclusion
The Impulse Indicator is a straightforward yet powerful tool that helps traders understand market momentum by combining EMAs and the MACD histogram. It simplifies complex market dynamics into three easily recognizable states: Impulse Up, Impulse Down, and Neutral. By offering a clear and concise visual representation, this indicator allows traders to quickly assess the market’s momentum and make more informed decisions.