The Babylon TrendValue Arrow (Non-Repaint) indicator is designed to assist traders in visualizing trends and potential trading signals on their charts. This indicator provides a set of clear arrows and lines to represent bullish and bearish trends, helping traders identify potential entry and exit points. By focusing on price data and moving averages, it aims to offer a straightforward visual tool for trend analysis without repainting past signals.
//---- drawing the indicator in the main window
#property indicator_chart_window
//---- 4 buffers are used for calculation and drawing the indicator
#property indicator_buffers 4
//---- 4 plots are used
#property indicator_plots   4
//+----------------------------------------------+
//|  Bullish indicator drawing parameters        |
//+----------------------------------------------+
//---- drawing the indicator 1 as a line
#property indicator_type1   DRAW_LINE
//---- blue color is used for the indicator line
#property indicator_color1  Blue
//---- the indicator 1 line is a dot-dash one
#property indicator_style1  STYLE_DASHDOTDOT
//---- indicator 1 line width is equal to 2
#property indicator_width1  2
//---- displaying the indicator line label
#property indicator_label1  "Upper TrendValue"
//+----------------------------------------------+
//|  Bearish indicator drawing parameters        |
//+----------------------------------------------+
//---- dawing the indicator 2 as a line
#property indicator_type2   DRAW_LINE
//---- medium violet red color is used for the indicator line
#property indicator_color2  MediumVioletRed
//---- the indicator 2 line is a dot-dash one
#property indicator_style2  STYLE_DASHDOTDOT
//---- indicator 2 line width is equal to 2
#property indicator_width2  2
//---- displaying the indicator line label
#property indicator_label2  "Lower TrendValue"
//+----------------------------------------------+
//|  Bullish indicator drawing parameters        |
//+----------------------------------------------+
//---- drawing the indicator 3 as a label
#property indicator_type3   DRAW_ARROW
//---- deep sky blue color is used for the indicator
#property indicator_color3  DeepSkyBlue
//---- indicator 3 width is equal to 4
#property indicator_width3  4
//---- displaying the indicator label
#property indicator_label3  "Buy TrendValue"
//+----------------------------------------------+
//|  Bearish indicator drawing parameters        |
//+----------------------------------------------+
//---- drawing the indicator 4 as a label
#property indicator_type4   DRAW_ARROW
//---- red color is used for the indicator
#property indicator_color4  Red
//---- indicator 4 width is equal to 4
#property indicator_width4  4
//---- displaying the indicator label
#property indicator_label4  "Sell TrendValue"
//+----------------------------------------------+
//|  Indicator input parameters                  |
//+----------------------------------------------+
input int    period=13;           // Moving averages period
input double shiftPercent=0;      // Horizontal shift of the indicator in percents
input int    ATRPeriod=15;        // ATR indicator period
input double ATRSensitivity=1.5;  // ATR shift sensitivity
input int    Shift=0;             // Horizontal shift of the indicator in bars
//+----------------------------------------------+
//---- declaration of dynamic arrays that
//---- will be used as indicator buffers
double ExtMapBufferUp[];
double ExtMapBufferDown[];
double ExtMapBufferUp1[];
double ExtMapBufferDown1[];
//---- declaration of integer variables for the indicators handles
int ATR_Handle,HMA_Handle,LMA_Handle;
//---- declaration of the integer variables for the start of data calculation
int min_rates_total;
//+------------------------------------------------------------------+
//| Custom indicator initialization function                         |
//+------------------------------------------------------------------+
int OnInit()
  {
//---- getting handle of the ATR indicator
   ATR_Handle=iATR(NULL,0,ATRPeriod);
   if(ATR_Handle==INVALID_HANDLE)
     {
      Print(" Failed to get handle of the ATR indicator");
      return(1);
     }

//---- getting handle of the HMA indicator
   HMA_Handle=iMA(NULL,0,period,0,MODE_LWMA,PRICE_HIGH);
   if(HMA_Handle==INVALID_HANDLE)
     {
      Print(" Failed to get handle of the HMA indicator");
      return(1);
     }

//---- getting handle of the LMA indicator
   LMA_Handle=iMA(NULL,0,period,0,MODE_LWMA,PRICE_LOW);
   if(LMA_Handle==INVALID_HANDLE)
     {
      Print(" Failed to get handle of the LMA indicator");
      return(1);
     }

//---- initialization of variables of the start of data calculation
   min_rates_total=ATRPeriod+period;

//---- set ExtMapBufferUp[] dynamic array as an indicator buffer
   SetIndexBuffer(0,ExtMapBufferUp,INDICATOR_DATA);
//---- shifting the indicator 1 horizontally by Shift
   PlotIndexSetInteger(0,PLOT_SHIFT,Shift);
//---- shifting the start of drawing of the indicator 1
   PlotIndexSetInteger(0,PLOT_DRAW_BEGIN,min_rates_total);
//---- indexing the elements in buffers as timeseries
   ArraySetAsSeries(ExtMapBufferUp,true);
//---- setting the indicator values that won't be visible on a chart
   PlotIndexSetDouble(0,PLOT_EMPTY_VALUE,EMPTY_VALUE);

//---- set ExtMapBufferDown[] dynamic array as an indicator buffer
   SetIndexBuffer(1,ExtMapBufferDown,INDICATOR_DATA);
//---- shifting the indicator 2 horizontally by Shift
   PlotIndexSetInteger(1,PLOT_SHIFT,Shift);
//---- shifting the start of drawing of the indicator 2
   PlotIndexSetInteger(1,PLOT_DRAW_BEGIN,min_rates_total);
//---- indexing the elements in buffers as timeseries
   ArraySetAsSeries(ExtMapBufferDown,true);
//---- setting the indicator values that won't be visible on a chart
   PlotIndexSetDouble(1,PLOT_EMPTY_VALUE,EMPTY_VALUE);

//---- set ExtMapBufferUp1[] dynamic array as an indicator buffer
   SetIndexBuffer(2,ExtMapBufferUp1,INDICATOR_DATA);
//---- shifting the indicator 1 horizontally by Shift
   PlotIndexSetInteger(2,PLOT_SHIFT,Shift);
//---- shifting the start of drawing the indicator 3
   PlotIndexSetInteger(2,PLOT_DRAW_BEGIN,min_rates_total);
//---- indexing the elements in buffers as timeseries
   ArraySetAsSeries(ExtMapBufferUp1,true);
//---- setting the indicator values that won't be visible on a chart
   PlotIndexSetDouble(2,PLOT_EMPTY_VALUE,EMPTY_VALUE);
//---- indicator symbol
   PlotIndexSetInteger(2,PLOT_ARROW,117);

//---- set ExtMapBufferDown1[] dynamic array as an indicator buffer
   SetIndexBuffer(3,ExtMapBufferDown1,INDICATOR_DATA);
//---- shifting the indicator 2 horizontally by Shift
   PlotIndexSetInteger(3,PLOT_SHIFT,Shift);
//---- shifting the start of drawing the indicator 4
   PlotIndexSetInteger(3,PLOT_DRAW_BEGIN,min_rates_total);
//---- indexing the elements in buffers as timeseries
   ArraySetAsSeries(ExtMapBufferDown1,true);
//---- setting the indicator values that won't be visible on a chart
   PlotIndexSetDouble(3,PLOT_EMPTY_VALUE,EMPTY_VALUE);
//---- indicator symbol
   PlotIndexSetInteger(3,PLOT_ARROW,117);

//---- initializations of a variable for the indicator short name
   string shortname;
   StringConcatenate(shortname,"TrendValue(",period,", ",shiftPercent,", ",ATRPeriod,", ",ATRSensitivity,", ",Shift,")");
//--- creation of the name to be displayed in a separate sub-window and in a tooltip
   IndicatorSetString(INDICATOR_SHORTNAME,shortname);
//--- determination of accuracy of displaying the indicator values
   IndicatorSetInteger(INDICATOR_DIGITS,_Digits);
//----
   return(0);
  }
//+------------------------------------------------------------------+
//| Custom indicator iteration function                              |
//+------------------------------------------------------------------+
int OnCalculate(const int rates_total,    // number of bars in history at the current tick
                const int prev_calculated,// number of bars calculated at previous call
                const datetime &time[],
                const double &open[],
                const double& high[],     // price array of maximums of price for the indicator calculation
                const double& low[],      // price array of minimums of price for the indicator calculation
                const double &close[],
                const long &tick_volume[],
                const long &volume[],
                const int &spread[])
  {
//---- checking the number of bars to be enough for the calculation
   if(BarsCalculated(ATR_Handle)<rates_total
      || BarsCalculated(HMA_Handle)<rates_total
      || BarsCalculated(LMA_Handle)<rates_total
      || rates_total<min_rates_total)
      return(0);

//---- declarations of local variables
   double ATR[],HMA[],LMA[],atr;
   double highMoving0,lowMoving0;
   int limit,to_copy,bar,trend,maxbar;
   static double highMoving1,lowMoving1;
   static int trend_;

//---- indexing elements in arrays as timeseries
   ArraySetAsSeries(close,true);
   ArraySetAsSeries(ATR,true);
   ArraySetAsSeries(HMA,true);
   ArraySetAsSeries(LMA,true);

//---- calculation of the 'limit' starting index for the bars recalculation loop
   if(prev_calculated>rates_total || prev_calculated<=0) // checking for the first start of the indicator calculation
     {
      limit=rates_total-min_rates_total-1;               // starting index for calculation of all bars
      trend_=0;
     }
   else
     {
      limit=rates_total-prev_calculated;                 // starting index for calculation of new bars
     }

   maxbar=rates_total-min_rates_total-1;

   to_copy=limit+1;
//--- copy newly appeared data in the arrays
   if(CopyBuffer(ATR_Handle,0,0,to_copy,ATR)<=0) return(0);
   if(CopyBuffer(HMA_Handle,0,0,to_copy,HMA)<=0) return(0);
   if(CopyBuffer(LMA_Handle,0,0,to_copy,LMA)<=0) return(0);

//---- restore values of the variables
   trend=trend_;

//---- main indicator calculation loop
   for(bar=limit; bar>=0; bar--)
     {
      //---- store values of the variables before running at the current bar
      if(rates_total!=prev_calculated && bar==0)
         trend_=trend;

      atr=ATR[bar]*ATRSensitivity;
      highMoving0= HMA[bar] *(1+shiftPercent/100)+atr;
      lowMoving0 = LMA[bar] *(1-shiftPercent/100)-atr;

      if(bar>maxbar)
        {
         lowMoving1=lowMoving0;
         highMoving1=highMoving0;
         continue;
        }

      if(close[bar] > highMoving1)trend = +1;
      if(close[bar] < lowMoving1) trend = -1;

      if(trend>0.0)
        {
         lowMoving0=MathMax(lowMoving0,lowMoving1);
         ExtMapBufferUp[bar]=lowMoving0;
         ExtMapBufferDown[bar]=EMPTY_VALUE;
        }

      if(trend<0.0)
        {
         highMoving0=MathMin(highMoving0,highMoving1);
         ExtMapBufferDown[bar]=highMoving0;
         ExtMapBufferUp[bar]=EMPTY_VALUE;
        }

      if(ExtMapBufferUp[bar+1]==EMPTY_VALUE && ExtMapBufferUp[bar]!=EMPTY_VALUE)
         ExtMapBufferUp1[bar]=ExtMapBufferUp[bar];

      if(ExtMapBufferDown[bar+1]==EMPTY_VALUE && ExtMapBufferDown[bar]!=EMPTY_VALUE)
         ExtMapBufferDown1[bar]=ExtMapBufferDown[bar];

      if(bar>0)
        {
         lowMoving1=lowMoving0;
         highMoving1=highMoving0;
        }
     }
//----
   return(rates_total);
  }
//+------------------------------------------------------------------+
Indicator Overview
The TrendValue indicator consists of several key components and parameters that work together to produce actionable signals on a trading chart. The primary goal of this indicator is to highlight trends and potential entry or exit points based on historical price data and moving averages.
Key Components
Indicator Buffers
The indicator uses four buffers to manage and display its data:
- ExtMapBufferUp: This buffer stores data for bullish trends.
- ExtMapBufferDown: This buffer stores data for bearish trends.
- ExtMapBufferUp1: This buffer is used to mark specific points within bullish trends.
- ExtMapBufferDown1: This buffer is used to mark specific points within bearish trends.
These buffers are essential for storing the calculated values that will be plotted on the chart.
Drawing Parameters
The TrendValue indicator has various settings for how it displays its information on the chart:
- Bullish Indicator (Upper TrendValue):
- Type: Line
- Color: Blue
- Style: Dot-dash
- Width: 2
- Bearish Indicator (Lower TrendValue):
- Type: Line
- Color: Medium Violet Red
- Style: Dot-dash
- Width: 2
- Bullish Arrow (Buy TrendValue):
- Type: Arrow
- Color: Deep Sky Blue
- Width: 4
- Bearish Arrow (Sell TrendValue):
- Type: Arrow
- Color: Red
- Width: 4
Each of these settings ensures that the indicators are visually distinct and easy to interpret.
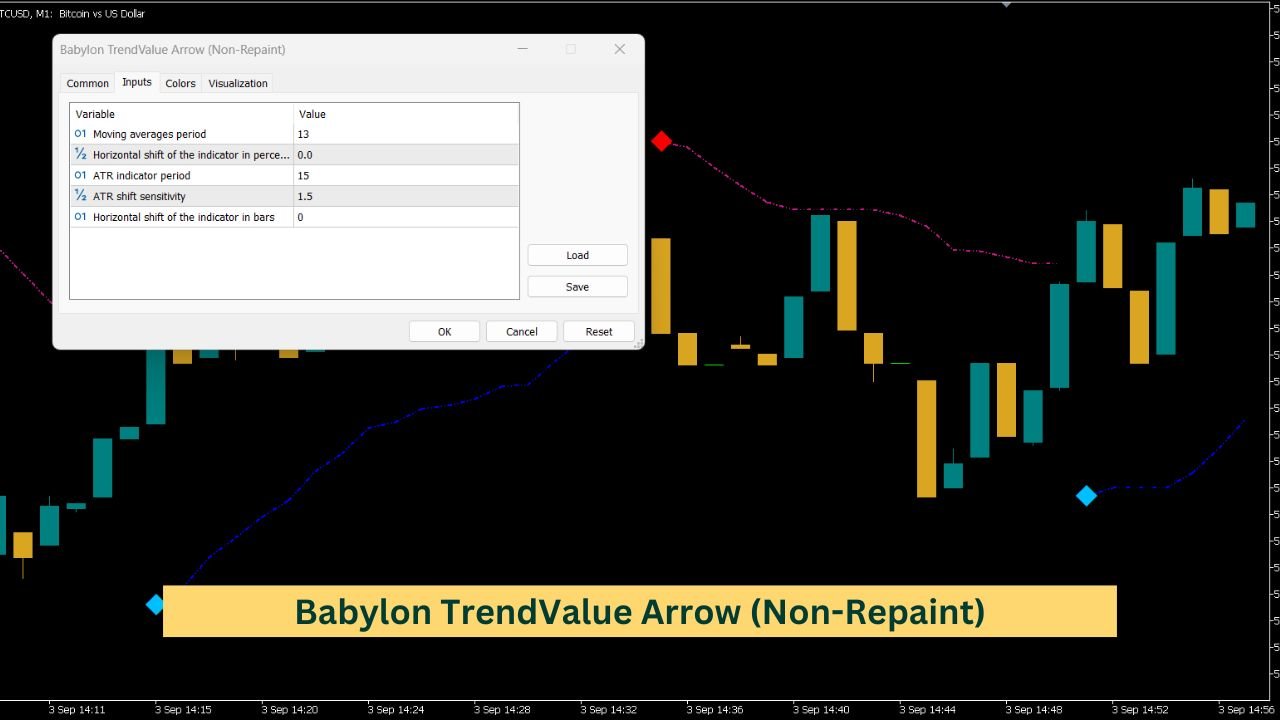
Input Parameters
The indicator comes with several customizable input parameters that allow traders to adjust its behavior according to their needs:
- Period: Defines the period for the moving averages used in the indicator.
- Shift Percent: Adjusts the horizontal shift of the indicator on the chart, expressed as a percentage.
- ATR Period: Sets the period for the Average True Range (ATR) indicator, which helps measure market volatility.
- ATR Sensitivity: Adjusts the sensitivity of the ATR shift.
- Shift: Sets the horizontal shift of the indicator in bars on the chart.
How It Works
The TrendValue indicator operates by analyzing price data and applying specific mathematical calculations to generate its signals. Here’s a general overview of its functionality:
- Initialization: Upon initialization, the indicator sets up its buffers and parameters. It retrieves handles for various indicators, including ATR and moving averages.
- Data Handling: The indicator collects price data and performs calculations to determine trend direction. It then updates its buffers with the calculated values.
- Trend Calculation: The indicator calculates the bullish and bearish trend values based on moving averages and ATR. These values are used to determine where to place the indicator lines and arrows on the chart.
- Signal Generation: It plots the bullish and bearish indicators on the chart. Bullish signals are marked with a line and an arrow, while bearish signals are similarly marked.
Practical Application
The TrendValue indicator is designed to assist traders in identifying trends and potential trade opportunities. By analyzing the trend lines and arrows, traders can make informed decisions about when to enter or exit trades.
Conclusion
The TrendValue indicator provides a visual representation of market trends, helping traders make more informed decisions. Its clear visual signals and customizable parameters make it a valuable tool for those looking to analyze price trends and optimize their trading strategies. By understanding how this indicator works, you can better utilize it to enhance your trading approach.