The FX Grid Trading System v1.1 (Non-Repaint) is a charting tool designed to help traders visualize price levels through a grid overlay. This indicator plots horizontal lines at specified intervals based on user-defined parameters, creating a grid that can assist in monitoring price movements. It features customizable grid spacing, visual styles, and label options, making it adaptable to various trading strategies and charting preferences. By providing a clear and structured view of price levels, this indicator aims to support your trading decisions without affecting the integrity of the price data.
#property description "Chart evaluation in deposit currency"
#property strict
#property indicator_chart_window
#property indicator_plots 0

//+------------------------------------------------------------------+
//| Input parameters                                                 |
//+------------------------------------------------------------------+
input double grid_step_value = 100;     // Grid step value in currency
input double lot_size = 0.1;            // Initial lot size
input double lot_divider = 1;           // Lot size divider
input double total_levels = 50;         // Number of grid levels
input double zero_price = 0;            // Custom zero price (if 0, current price is used)

enum PROGRESSION {none, equal, linear, fibo, martin};
input PROGRESSION progression = none;   // Type of progression for grid levels
input double multiplicator = 2;         // Multiplier used in progression (e.g., martingale)
input color lines_color = clrMagenta;   // Color of grid lines
input int lines_width = 1;              // Width of grid lines
input ENUM_LINE_STYLE lines_style = STYLE_SOLID; // Style of grid lines
input bool lines_prices = false;        // Show prices on lines
input int text_shift_bars = 0;          // Shift for text display in bars

//+------------------------------------------------------------------+
//| Initialization function                                           |
//+------------------------------------------------------------------+
int OnInit() {
   clean_all(); // Remove any previous grid objects from the chart
   make_grid(); // Generate the grid levels
   return(INIT_SUCCEEDED);
}

//+------------------------------------------------------------------+
//| Deinitialization function                                         |
//+------------------------------------------------------------------+
void OnDeinit(const int reason) {
   clean_all(); // Clean up objects when indicator is removed
}

//+------------------------------------------------------------------+
//| Main calculation function                                         |
//+------------------------------------------------------------------+
int OnCalculate(const int rates_total, const int prev_calculated, const datetime &time[],
                const double &open[], const double &high[], const double &low[],
                const double &close[], const long &tick_volume[], const long &volume[],
                const int &spread[]) {
   return(rates_total); // No specific calculation needed, just return rates_total
}

//+------------------------------------------------------------------+
//| Function to remove grid objects from the chart                    |
//+------------------------------------------------------------------+
void clean_all() {
   // Delete horizontal lines named "GRID_LEVEL_*"
   for(int k = ObjectsTotal(0, 0, OBJ_HLINE) - 1; k >= 0; k--) {
      string name = ObjectName(0, k, 0, OBJ_HLINE);
      if(StringFind(name, "GRID_LEVEL_") != -1) ObjectDelete(0, name);
   }

   // Delete text objects named "GRID_TEXT_*"
   for(int k = ObjectsTotal(0, 0, OBJ_TEXT) - 1; k >= 0; k--) {
      string name = ObjectName(0, k, 0, OBJ_TEXT);
      if(StringFind(name, "GRID_TEXT_") != -1) ObjectDelete(0, name);
   }
}

//+------------------------------------------------------------------+
//| Function to create grid lines and text                            |
//+------------------------------------------------------------------+
void make_grid() {
   double ts = SymbolInfoDouble(_Symbol, SYMBOL_TRADE_TICK_SIZE); // Tick size
   double tv = SymbolInfoDouble(_Symbol, SYMBOL_TRADE_TICK_VALUE); // Tick value
   double step = grid_step_value / tv * ts / lot_size / lot_divider; // Step size for grid levels
   double zero = zero_price ? zero_price : iClose(NULL, 0, 0); // Get zero price (either custom or current price)

   // Calculate the time for text labels based on the shift
   datetime time;
   if(text_shift_bars >= 0) time = iTime(NULL, 0, text_shift_bars);
   else time = iTime(NULL, 0, 0) - PeriodSeconds(PERIOD_CURRENT) * text_shift_bars;

   // Create the zero-level line and text
   put_level("GRID_LEVEL_ZERO", zero, "(ZERO)");
   put_text("GRID_TEXT_ZERO", zero, time, "(ZERO)");

   // Create the grid levels above and below the zero line
   for(int n = 1; n <= total_levels; n++) {
      double value = grid_step_value * get_progression(n);
      string text = DoubleToString(value, 2);

      put_level("GRID_LEVEL_UP" + string(n), zero + step * n, "+" + text);
      put_level("GRID_LEVEL_DN" + string(n), zero - step * n, "-" + text);
      put_text("GRID_TEXT_UP" + string(n), zero + step * n, time, "+" + text);
      put_text("GRID_TEXT_DN" + string(n), zero - step * n, time, "-" + text);
   }
}

//+------------------------------------------------------------------+
//| Function to get progression value based on selected progression   |
//+------------------------------------------------------------------+
double get_progression(int n) {
   if(progression == none) return n; // No progression, return level number

   double sum = 0;
   for(int k = 1; k <= n; k++) sum += (n - k + 1) * get_member(k); // Sum progression values
   return sum;
}

//+------------------------------------------------------------------+
//| Function to get the progression multiplier for each level         |
//+------------------------------------------------------------------+
double get_member(int k) {
   if(progression == equal) {
      return 1; // Equal progression
   } else if(progression == fibo) {
      if(k < 3) return 1; // Fibonacci progression for first two levels
      int f = 1, s = 1;
      while(k > 2) { f = f + s * 2; s = f - s; f = f - s; k--; }
      return s;
   } else if(progression == martin) {
      return MathPow(multiplicator, k - 1); // Martingale progression
   } else if(progression == linear) {
      return k; // Linear progression
   }
   return 1; // Default to equal progression
}

//+------------------------------------------------------------------+
//| Function to create a horizontal line at the specified price       |
//+------------------------------------------------------------------+
void put_level(string name, double price, string text) {
   ObjectCreate(0, name, OBJ_HLINE, 0, 0, 0); // Create horizontal line
   ObjectSetDouble(0, name, OBJPROP_PRICE, price); // Set price for the line
   ObjectSetInteger(0, name, OBJPROP_COLOR, lines_color); // Set line color
   ObjectSetInteger(0, name, OBJPROP_WIDTH, lines_width); // Set line width
   ObjectSetInteger(0, name, OBJPROP_STYLE, lines_style); // Set line style
   ObjectSetInteger(0, name, OBJPROP_SELECTABLE, false); // Line not selectable
   ObjectSetInteger(0, name, OBJPROP_SELECTED, false); // Line not selected
   ObjectSetInteger(0, name, OBJPROP_BACK, !lines_prices); // Set line to background if prices are not shown
   ObjectSetString(0, name, OBJPROP_TEXT, text); // Assign text label to the line
}

//+------------------------------------------------------------------+
//| Function to create text label at the specified price and time     |
//+------------------------------------------------------------------+
void put_text(string name, double price, datetime time, string text) {
   ObjectCreate(0, name, OBJ_TEXT, 0, 0, 0); // Create text object
   ObjectSetDouble(0, name, OBJPROP_PRICE, price); // Set price for the text
   ObjectSetInteger(0, name, OBJPROP_TIME, 0, time); // Set time for the text
   ObjectSetString(0, name, OBJPROP_TEXT, text); // Set the text string
   ObjectSetString(0, name, OBJPROP_FONT, "Verdana"); // Set font
   ObjectSetInteger(0, name, OBJPROP_COLOR, lines_color); // Set text color
   ObjectSetInteger(0, name, OBJPROP_FONTSIZE, 8); // Set text size
   ObjectSetInteger(0, name, OBJPROP_ANCHOR, ANCHOR_RIGHT_UPPER); // Set anchor point for text
   ObjectSetInteger(0, name, OBJPROP_SELECTABLE, false); // Text not selectable
   ObjectSetInteger(0, name, OBJPROP_SELECTED, false); // Text not selected
}
//+------------------------------------------------------------------+
What Is a Grid Trading Indicator?
A grid trading indicator essentially sets up horizontal price levels at specific intervals, referred to as “grid levels.” These levels act as price zones where market decisions, such as buying or selling, could potentially occur.
This particular indicator uses a grid step value to determine the spacing between each level, and it can handle up to 50 levels above and below the current price. Users can customize the distance between grid lines, the width of the lines, and the text labels associated with each level.
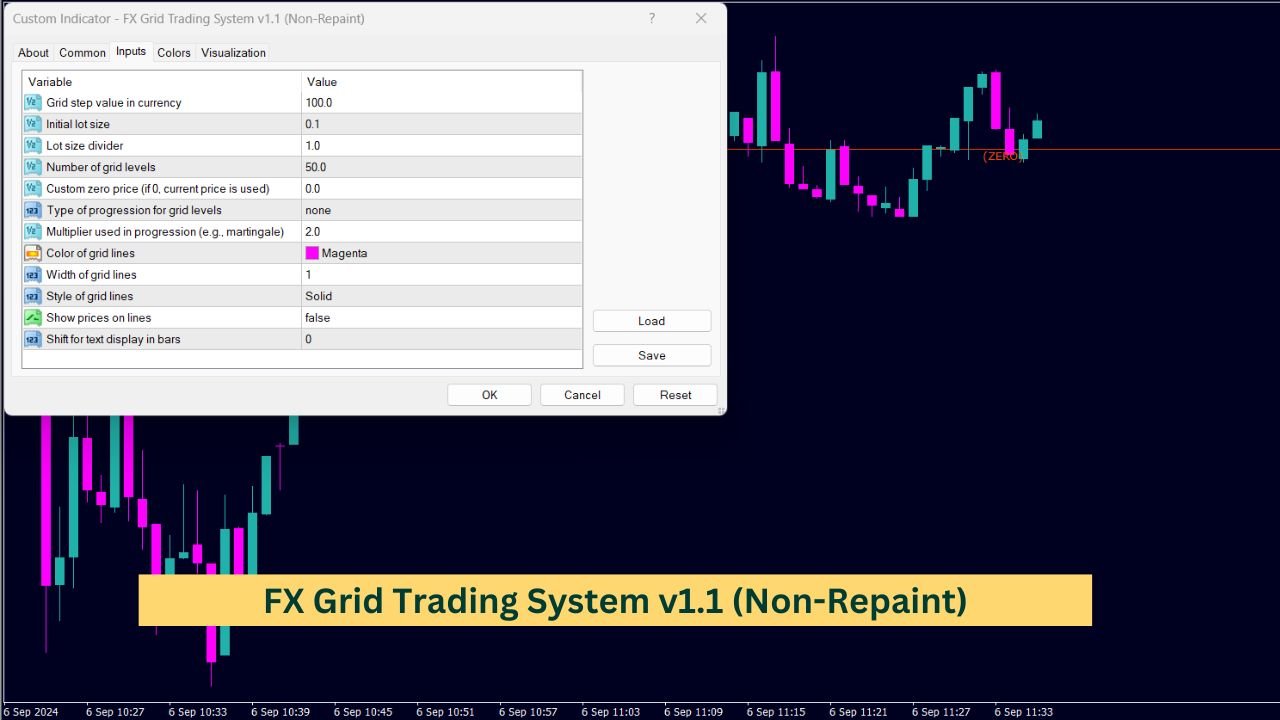
Key Inputs and Customizations
The indicator offers a number of input options to adjust how it behaves. These are set through a series of user-defined parameters, allowing for a high level of customization. Here’s a summary of the key inputs:
- Grid Step Value: This defines the distance between each grid level in terms of price points.
- Lot Size: This determines the position size that is factored into the calculation of the grid levels.
- Total Levels: Users can set the number of levels above and below the zero price (up to 50).
- Zero Price: The base price level from which the grid starts. If left at zero, the current price is used as the reference.
These inputs enable you to adjust the grid to fit different trading styles, market conditions, and personal preferences.
Progression Types: A Unique Feature
A distinctive aspect of this grid indicator is its progression type. It offers several progression methods for the grid levels, meaning the distance between levels can follow different patterns. Here are the available progression options:
- None: Grid levels are equally spaced, with no changes in distance between them.
- Equal: Grid spacing remains uniform throughout all levels.
- Linear: The distance between grid levels increases at a constant rate.
- Fibonacci (Fibo): Grid levels follow the Fibonacci sequence, with the spacing between them increasing in proportion.
- Martingale (Martin): The spacing between levels grows exponentially, doubling at each step.
The flexibility to choose different progression types makes the indicator adaptable to various trading strategies and risk profiles.
How the Indicator Handles Price Levels
When the grid is created, the indicator calculates levels both above and below the zero price. It then assigns a name and a label to each level, which appears on the chart for easy reference.
For example, if the grid step is 100 points, the levels above the zero price will incrementally increase by that amount. Similarly, the levels below will decrease by the same step size. The text labels for each level are automatically displayed on the chart, providing clarity on the specific price points for each grid line.
Visual Customization Options
This indicator allows users to modify how the grid levels are visually represented on the chart. You can change the following:
- Line Color: The color of the grid lines can be customized to suit your chart’s color scheme. In this case, the default color is magenta.
- Line Width: The width of the grid lines can also be adjusted.
- Line Style: The indicator offers different line styles, such as solid, dashed, or dotted lines, depending on your preference.
- Price Labels: You can choose whether or not to display the price labels for each grid level.
These options help make the indicator visually intuitive and easy to work with on any trading chart.
Cleaning and Redrawing the Grid
Whenever the indicator is removed or refreshed, it automatically cleans all the grid lines and text labels from the chart. This ensures that no residual elements are left behind, keeping your chart clutter-free.
The indicator also recalculates and redraws the grid each time the market ticks or when a new bar forms. However, this could potentially be optimized to improve efficiency, as the recalculation occurs regardless of whether any parameters have changed.
Points of Improvement
While the indicator is quite robust, there are a couple of areas where improvements could be made:
- Recalculation Efficiency: Currently, the grid is recalculated with every new tick, which is unnecessary if no input parameters have changed. Implementing a check to recalculate the grid only when adjustments are made would improve the indicator’s efficiency.
- Progression Calculation: The way the progression is calculated could be optimized, especially for Fibonacci and Martingale progressions. While the current approach works, there’s potential for refining the calculation to make it more computationally efficient.
Final Thoughts
This Grid Trading Indicator offers a customizable and dynamic way to visualize key price levels on your trading chart. Its flexibility in grid spacing, visual representation, and progression types makes it useful for a variety of market conditions and trading strategies.
However, like any tool, it’s important to understand its limitations. This indicator does not provide trade signals or predictions; instead, it offers a structured way to monitor price levels and market behavior.