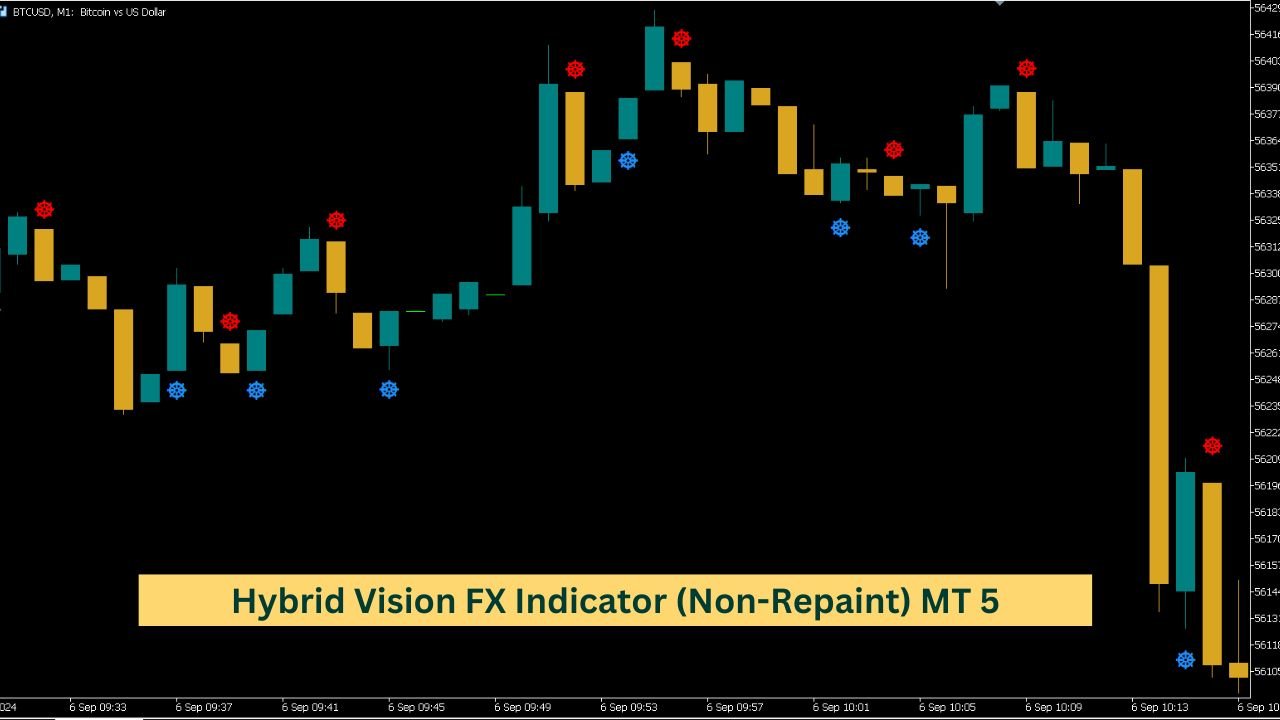
The Hybrid Vision FX indicator is a technical analysis tool designed to assist traders in visualizing market trends. By employing advanced smoothing techniques, this indicator processes historical price data and plots a line on the chart, allowing traders to observe and analyze market movements. The non-repaint nature of the Hybrid Vision FX ensures that once a value is plotted, it remains fixed, providing a stable reference for analysis. This indicator integrates a set of parameters that can be customized to align with different trading strategies, helping traders gain insights into market behavior.
#property indicator_chart_window
//---- One buffer is used for the calculation and drawing of the indicator
#property indicator_buffers 1
//---- Only one graphical plot is used
#property indicator_plots   1
//---- The indicator is drawn as a line
#property indicator_type1   DRAW_LINE
//---- The color of the indicator line is blue
#property indicator_color1  clrBlue
//---- The indicator line is a continuous curve
#property indicator_style1  STYLE_SOLID
//---- The thickness of the indicator line is 2
#property indicator_width1  2
//---- Label for the indicator
#property indicator_label1  "JFATL"

//+----------------------------------------------+
//| Declaration of enumerations                  |
//+----------------------------------------------+
enum Applied_price_ // Type constants
  {
   PRICE_CLOSE_ = 1,     // PRICE_CLOSE
   PRICE_OPEN_,          // PRICE_OPEN
   PRICE_HIGH_,          // PRICE_HIGH
   PRICE_LOW_,           // PRICE_LOW
   PRICE_MEDIAN_,        // PRICE_MEDIAN
   PRICE_TYPICAL_,       // PRICE_TYPICAL
   PRICE_WEIGHTED_,      // PRICE_WEIGHTED
   PRICE_SIMPL_,         // PRICE_SIMPL_
   PRICE_QUARTER_,       // PRICE_QUARTER_
   PRICE_TRENDFOLLOW0_,  // PRICE_TRENDFOLLOW0_
   PRICE_TRENDFOLLOW1_,  // TrendFollow_2 Price
   PRICE_DEMARK_         // Demark Price
  };

//+----------------------------------------------+
//| Indicator input parameters                  |
//+----------------------------------------------+
input uint iLength=5; // Depth of JMA smoothing
input int iPhase=100; // JMA smoothing parameter
//---- Ranges from -100 to +100, affects transition quality
input Applied_price_ IPC=PRICE_CLOSE_; // Price constant
input int FATLShift=0;  // Horizontal shift of FATL in bars
input int PriceShift=0; // Vertical shift of FATL in points

//+----------------------------------------------+
//| Declaration and initialization of variables  |
//+----------------------------------------------+
int FATLPeriod=39; // Number of bars for FATL calculation
double ExtLineBuffer[]; // Indicator buffer array

int start, fstart, FATLSize;
double dPriceShift;

//+------------------------------------------------------------------+
//| Initialization of digital filter coefficients                      |
//+------------------------------------------------------------------+
double dFATLTable[]=
  {
   +0.4360409450, +0.3658689069, +0.2460452079, +0.1104506886,
   -0.0054034585, -0.0760367731, -0.0933058722, -0.0670110374,
   -0.0190795053, +0.0259609206, +0.0502044896, +0.0477818607,
   +0.0249252327, -0.0047706151, -0.0272432537, -0.0338917071,
   -0.0244141482, -0.0055774838, +0.0128149838, +0.0226522218,
   +0.0208778257, +0.0100299086, -0.0036771622, -0.0136744850,
   -0.0160483392, -0.0108597376, -0.0016060704, +0.0069480557,
   +0.0110573605, +0.0095711419, +0.0040444064, -0.0023824623,
   -0.0067093714, -0.0072003400, -0.0047717710, +0.0005541115,
   +0.0007860160, +0.0130129076, +0.0040364019
  };

//+------------------------------------------------------------------+
//| Include necessary library for smooth algorithms                    |
//+------------------------------------------------------------------+
#include <SmoothAlgorithms.mqh>

//+------------------------------------------------------------------+
//| Custom indicator initialization function                         |
//+------------------------------------------------------------------+
void OnInit()
  {
   //---- Initialize the indicator buffer
   SetIndexBuffer(0, ExtLineBuffer, INDICATOR_DATA);
   //---- Set horizontal shift for the indicator
   PlotIndexSetInteger(0, PLOT_SHIFT, FATLShift);
   //---- Initialize variables
   FATLSize = ArraySize(dFATLTable);
   start = FATLSize + 30;
   //---- Set the start point for drawing the indicator
   PlotIndexSetInteger(0, PLOT_DRAW_BEGIN, start);
   //---- Initialize the short name of the indicator
   string shortname;
   StringConcatenate(shortname, "JFATL(", iLength, " ,", iPhase, ")");
   //---- Set the label for the DataWindow
   PlotIndexSetString(0, PLOT_LABEL, shortname);
   //---- Set the name for display in a separate subwindow and tooltip
   IndicatorSetString(INDICATOR_SHORTNAME, shortname);
   //---- Define the precision of indicator values
   IndicatorSetInteger(INDICATOR_DIGITS, _Digits + 1);
   //---- Prevent drawing empty values
   PlotIndexSetDouble(0, PLOT_EMPTY_VALUE, 0.0);
   //---- Initialize vertical shift
   dPriceShift = _Point * PriceShift;
   //---- Declare the CJJMA class from the included file
   CJJMA JMA;
   //---- Set alerts for invalid external variable values
   JMA.JJMALengthCheck("iLength", iLength);
   JMA.JJMAPhaseCheck("iPhase", iPhase);
  }

//+------------------------------------------------------------------+
//| Custom indicator calculation function                           |
//+------------------------------------------------------------------+
int OnCalculate(const int rates_total,    // Total number of bars in history for the current tick
                const int prev_calculated, // Number of bars in history for the previous tick
                const datetime &time[],
                const double &open[],
                const double &high[],
                const double &low[],
                const double &close[],
                const long &tick_volume[],
                const long &volume[],
                const int &spread[])
  {
   //---- Check if there are enough bars for calculation
   if(rates_total < start)
      return(0);

   //---- Declare local variables
   int first, bar;
   double jfatl, FATL;

   //---- Calculate the starting index for the bar calculation loop
   if(prev_calculated > rates_total || prev_calculated <= 0) // Check for the first calculation start
     {
      first = FATLPeriod - 1; // Start index for calculating all bars
      fstart = first;
     }
   else
      first = prev_calculated - 1; // Start index for calculating new bars

   //---- Declare the CJJMA class from the included file
   static CJJMA JMA;

   //---- Main calculation loop for the indicator
   for(bar = first; bar < rates_total; bar++)
     {
      //---- FATL filter formula
      FATL = 0.0;
      for(int iii = 0; iii < FATLSize; iii++)
         FATL += dFATLTable[iii] * PriceSeries(IPC, bar - iii, open, low, high, close);

      //---- One call to the JJMASeries function
      //---- Parameters Phase and Length do not change for each bar (Din = 0)
      jfatl = JMA.JJMASeries(fstart, prev_calculated, rates_total, 0, iPhase, iLength, FATL, bar, false);

      //---- Set the indicator buffer with the calculated FATL value
      ExtLineBuffer[bar] = jfatl + dPriceShift;
     }

   return(rates_total);
  }
//+------------------------------------------------------------------+
What is the Hybrid Vision FX Indicator?
The Hybrid Vision FX indicator is a type of technical analysis tool used to identify trends in the market. It processes historical price data and plots a line on the chart that helps traders make informed decisions. The indicator uses a combination of smoothing techniques to filter out market noise and highlight significant trends.
Key Features of the Hybrid Vision FX Indicator
Indicator Type and Appearance
- Plot Type: The Hybrid Vision FX indicator is displayed as a line on the chart.
- Color: The line is drawn in blue to make it easily distinguishable from other elements on the chart.
- Line Style: It is a continuous, solid line with a thickness of 2, making it prominent and easy to follow.
Input Parameters
The indicator uses several input parameters to adjust its behavior:
- iLength: This parameter controls the depth of JMA smoothing, affecting how much historical data is used in the calculation.
- iPhase: This parameter adjusts the smoothing factor, which impacts how the indicator responds to market changes.
- IPC: Defines the price type used in calculations, such as closing prices or high prices.
- FATLShift and PriceShift: These parameters control the horizontal and vertical shifts of the indicator line, respectively.
How the Hybrid Vision FX Indicator Works
Initialization
When the Hybrid Vision FX indicator is initialized, it performs several tasks:
- Buffer Setup: It sets up an indicator buffer, which is an array that holds the calculated values for plotting.
- Shifting: It applies the horizontal shift (FATLShift) to position the indicator correctly on the chart.
- Variable Initialization: It initializes various variables, such as the size of the smoothing table and the starting point for drawing the indicator.
Calculation Process
The calculation process of the Hybrid Vision FX indicator involves:
- Checking Data Sufficiency: It ensures that there is enough historical data to perform calculations.
- Loop Through Bars: It iterates through each bar of data to compute the indicator’s value.
- Apply Filter Formula: The indicator uses a filter formula to process the price data. This involves multiplying historical price values by coefficients from a smoothing table.
- Plotting the Line: The calculated values are then used to plot the line on the chart, adjusted for any vertical shift (PriceShift).
Key Functions and Classes
The indicator relies on several functions and classes:
- PriceSeries Function: This function retrieves the price data based on the selected price type (e.g., closing price).
- JJMASeries Function: This function applies the JMA (Jurik Moving Average) smoothing to the calculated data, adjusting for the iPhase and iLength parameters.
Practical Applications
The Hybrid Vision FX indicator is used in various trading strategies to:
- Identify Trends: It helps traders spot the direction and strength of trends.
- Filter Out Noise: By smoothing the data, it reduces the impact of short-term fluctuations and highlights longer-term trends.
- Adjust Settings: Traders can modify input parameters to tailor the indicator’s sensitivity to their specific trading needs.
Conclusion
The Hybrid Vision FX indicator is a powerful tool for traders looking to analyze market trends. By understanding its input parameters and calculation process, traders can effectively use this indicator to make more informed trading decisions. The indicator’s ability to smooth data and highlight trends makes it a valuable addition to any trading strategy.