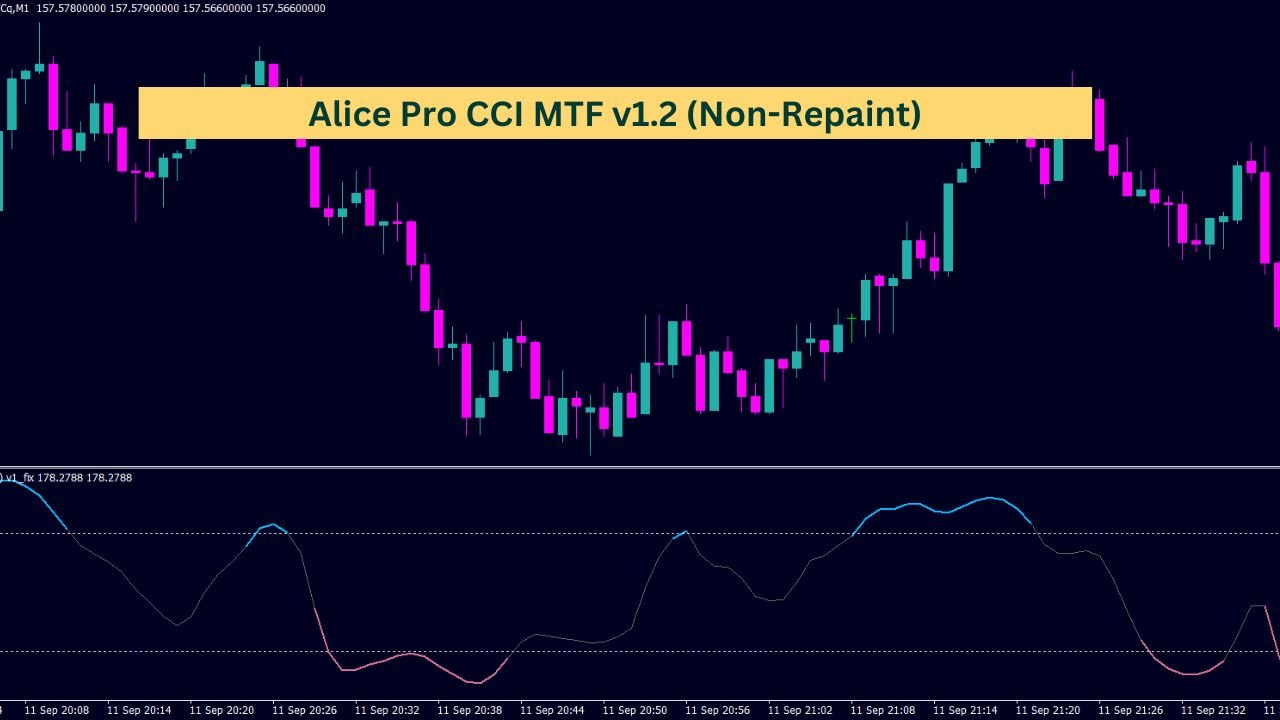
The Alice Pro CCI MTF v1.2 is a custom-built trading indicator that combines the classic Commodity Channel Index (CCI) with a multi-timeframe (MTF) capability. It is designed to help traders identify potential overbought or oversold conditions across different timeframes, while also integrating features like arrow signals to mark key zones and trend reversals.
#property indicator_separate_window               // Display indicator in a separate window
#property indicator_buffers 9                     // Define 9 buffers for the indicator
#property indicator_color1 DimGray                // Set color for the first plot line
#property indicator_width2 2                      // Set width for the second plot line
#property indicator_width3 2                      // Set width for the third plot line
#property indicator_width4 2                      // Set width for the fourth plot line
#property indicator_width5 2                      // Set width for the fifth plot line

//+------------------------------------------------------------------+
//|                      External Inputs                             |
//+------------------------------------------------------------------+
extern string TimeFrame = "current time frame";    // Set the time frame for the indicator
extern int CCIPeriod = 14;                         // Period for the CCI calculation
extern int CCIPrice = PRICE_TYPICAL;               // Price used in CCI calculation (Typical price)
extern double OverSold = -100;                     // Oversold level for CCI
extern double OverBought = 100;                    // Overbought level for CCI
extern double SmoothLength = 5;                    // Smoothing length for the indicator
extern double SmoothPhase = 0;                     // Smoothing phase for the indicator
extern color OverSoldColor = DeepSkyBlue;          // Color for oversold area lines
extern color OverBoughtColor = PaleVioletRed;      // Color for overbought area lines
extern bool ShowArrows = true;                     // Option to show arrows on chart
extern bool ShowArrowsZoneEnter = true;            // Option to show arrows when entering oversold/overbought zones
extern bool ShowArrowsZoneExit = true;             // Option to show arrows when exiting oversold/overbought zones
extern string arrowsIdentifier = "cci arrows";     // Identifier for arrow objects
extern color arrowsUpColor = DeepSkyBlue;          // Color for upward arrows
extern color arrowsDnColor = PaleVioletRed;        // Color for downward arrows
extern bool Interpolate = true;                    // Option to interpolate between data points
extern bool ShowArrBuf = true;                     // Option to show arrow buffer lines
extern int History = 3000;                         // History depth to calculate

//+------------------------------------------------------------------+
//|                       Indicator Buffers                          |
//+------------------------------------------------------------------+
double cci[];          // Main CCI values
double cciUpa[];       // Upper arrow buffer A for CCI
double cciUpb[];       // Upper arrow buffer B for CCI
double cciDna[];       // Lower arrow buffer A for CCI
double cciDnb[];       // Lower arrow buffer B for CCI
double prices[];       // Prices used for calculations
double trend[];        // Trend direction buffer

double SigUp1[];       // Buffer for upper signal arrows (entry)
double SigDn1[];       // Buffer for lower signal arrows (entry)
double SigUp2[];       // Buffer for upper signal arrows (exit)
double SigDn2[];       // Buffer for lower signal arrows (exit)

//+------------------------------------------------------------------+
//|                 Initialization Function (init)                   |
//+------------------------------------------------------------------+
int init()
{
   IndicatorBuffers(11);                              // Initialize 11 buffers for the indicator

   // Assign buffers and set line styles for CCI and trend indicators
   SetIndexBuffer(0,cci);
   SetIndexBuffer(1,cciUpa); SetIndexStyle(1,DRAW_LINE,EMPTY,EMPTY,OverSoldColor);
   SetIndexBuffer(2,cciUpb); SetIndexStyle(2,DRAW_LINE,EMPTY,EMPTY,OverSoldColor);
   SetIndexBuffer(3,cciDna); SetIndexStyle(3,DRAW_LINE,EMPTY,EMPTY,OverBoughtColor);
   SetIndexBuffer(4,cciDnb); SetIndexStyle(4,DRAW_LINE,EMPTY,EMPTY,OverBoughtColor);

   // Set buffers for signal arrows
   SetIndexBuffer(5,SigUp1); SetIndexArrow(5,233); SetIndexLabel(5,"SigUp1");
   SetIndexBuffer(6,SigDn1); SetIndexArrow(6,234); SetIndexLabel(6,"SigDn1");
   SetIndexBuffer(7,SigUp2); SetIndexArrow(7,233); SetIndexLabel(7,"SigUp2");
   SetIndexBuffer(8,SigDn2); SetIndexArrow(8,234); SetIndexLabel(8,"SigDn2");

   // Conditionally show or hide arrow buffers
   if(ShowArrBuf)
   {
      SetIndexStyle(5,DRAW_ARROW,EMPTY,EMPTY,OverSoldColor);
      SetIndexStyle(6,DRAW_ARROW,EMPTY,EMPTY,OverBoughtColor);
      SetIndexStyle(7,DRAW_ARROW,EMPTY,EMPTY,OverBoughtColor);
      SetIndexStyle(8,DRAW_ARROW,EMPTY,EMPTY,OverSoldColor);
   }
   else
   {
      SetIndexStyle(5,DRAW_NONE);
      SetIndexStyle(6,DRAW_NONE);
      SetIndexStyle(7,DRAW_NONE);
      SetIndexStyle(8,DRAW_NONE);
   }

   // Assign buffers for price and trend arrays
   SetIndexBuffer(9, prices);
   SetIndexBuffer(10, trend);

   // Set overbought/oversold levels
   SetLevelValue(0,OverBought);
   SetLevelValue(1,OverSold);

   // Parse input for different operational modes
   indicatorFileName = WindowExpertName();              // Retrieve the current indicator file name
   calculateValue = (TimeFrame == "CalculateValue");    // Mode to calculate values only
   returnBars = (TimeFrame == "returnBars");            // Mode to return the number of bars
   timeFrame = stringToTimeFrame(TimeFrame);            // Convert string to timeframe value

   // Set the indicator name based on the timeframe
   IndicatorShortName(timeFrameToString(timeFrame) + " CCI (" + CCIPeriod + ") v1_fix");

   return(0);
}

//+------------------------------------------------------------------+
//|                   De-initialization Function (deinit)            |
//+------------------------------------------------------------------+
int deinit()
{
   // Remove arrows if the indicator is de-initialized
   if (!calculateValue && ShowArrows)
      deleteArrows();

   return(0);
}

//+------------------------------------------------------------------+
//|                 Continue from Main Calculation                   |
//+------------------------------------------------------------------+
int start()
{
   int counted_bars = IndicatorCounted();
   int limit, i, k, n;

   if(counted_bars < 0) return(-1);
   if(counted_bars > 0) counted_bars--;
   limit = MathMin(Bars - counted_bars, History);
   if (returnBars) { cci[0] = limit + 1; return(0); }

   if (calculateValue || timeFrame == Period())
   {
      if (trend[limit] == 1) CleanPoint(limit, cciUpa, cciUpb);
      if (trend[limit] == -1) CleanPoint(limit, cciDna, cciDnb);

      for(i = limit; i >= 0; i--)
      {
         prices[i] = iMA(NULL, 0, 1, 0, MODE_SMA, CCIPrice, i);
         double avg = 0, dev = 0;

         // Calculate average and deviation for CCIPeriod
         for(k = 0; k < CCIPeriod; k++) avg += prices[i+k]; avg /= CCIPeriod;
         for(k = 0; k < CCIPeriod; k++) dev += MathAbs(prices[i+k] - avg); dev /= CCIPeriod;

         // Calculate CCI value
         if (dev != 0)
            cci[i] = iSmooth((prices[i] - avg) / (0.015 * dev), SmoothLength, SmoothPhase, i);
         else
            cci[i] = iSmooth(0, SmoothLength, SmoothPhase, i);

         // Reset values for trend plotting
         cciUpa[i] = cciUpb[i] = cciDna[i] = cciDnb[i] = EMPTY_VALUE;
         trend[i] = trend[i+1];

         // Update trend and plot points
         if (cci[i] > OverBought) trend[i] = 1;
         if (cci[i] < OverSold) trend[i] = -1;
         if (cci[i] > OverSold && cci[i] < OverBought) trend[i] = 0;

         if (trend[i] == 1) PlotPoint(i, cciUpa, cciUpb, cci);
         if (trend[i] == -1) PlotPoint(i, cciDna, cciDnb, cci);

         // Manage arrows based on trend direction
         if (!calculateValue) manageArrow(i);
      }
      return(0);
   }

   // Handle interpolation and timeframe management
   limit = MathMax(limit, MathMin(Bars, iCustom(NULL, timeFrame, indicatorFileName, "returnBars", 0, 0) * timeFrame / Period()));
   if (trend[limit] == 1) CleanPoint(limit, cciUpa, cciUpb);
   if (trend[limit] == -1) CleanPoint(limit, cciDna, cciDnb);

   for (i = limit; i >= 0; i--)
   {
      int y = iBarShift(NULL, timeFrame, Time[i]);

      // Get CCI and trend values from the custom timeframe indicator
      cci[i] = iCustom(NULL, timeFrame, indicatorFileName, "CalculateValue", CCIPeriod, CCIPrice, OverSold, OverBought, SmoothLength, SmoothPhase, 0, y);
      trend[i] = iCustom(NULL, timeFrame, indicatorFileName, "CalculateValue", CCIPeriod, CCIPrice, OverSold, OverBought, SmoothLength, SmoothPhase, 6, y);

      // Reset arrow buffers
      cciUpa[i] = cciUpb[i] = cciDna[i] = cciDnb[i] = EMPTY_VALUE;
      manageArrow(i);

      // If interpolation is enabled, process intermediate points
      if (Interpolate && y != iBarShift(NULL, timeFrame, Time[i-1]))
      {
         datetime time = iTime(NULL, timeFrame, y);
         for(n = 1; i+n < Bars && Time[i+n] >= time; n++) continue;
         for(k = 1; k < n; k++) cci[i+k] = cci[i] + (cci[i+n] - cci[i]) * k / n;
      }
   }

   // Plot points based on trend direction
   for (i = limit; i >= 0; i--)
   {
      if (trend[i] == 1) PlotPoint(i, cciUpa, cciUpb, cci);
      if (trend[i] == -1) PlotPoint(i, cciDna, cciDnb, cci);
   }

   return(0);
}

//+------------------------------------------------------------------+
//|                 Manage Arrows on the Chart                       |
//+------------------------------------------------------------------+
void manageArrow(int i)
{
   if (ShowArrows)
   {
      // Clear previous arrows
      SigUp1[i] = EMPTY_VALUE;
      SigDn1[i] = EMPTY_VALUE;
      SigUp2[i] = EMPTY_VALUE;
      SigDn2[i] = EMPTY_VALUE;

      deleteArrow(Time[i]);

      // Show arrows when trend changes
      if (trend[i] != trend[i+1])
      {
         if (ShowArrowsZoneEnter && trend[i] == 1)        { drawArrow(i, arrowsUpColor, 241, false); SigUp1[i] = 1; }
         if (ShowArrowsZoneEnter && trend[i] == -1)       { drawArrow(i, arrowsDnColor, 242, true);  SigDn1[i] = -1; }
         if (ShowArrowsZoneExit && trend[i+1] == -1 && trend[i] != -1) { drawArrow(i, arrowsDnColor, 241, false); SigUp2[i] = 1; }
         if (ShowArrowsZoneExit && trend[i+1] == 1 && trend[i] != 1)  { drawArrow(i, arrowsUpColor, 242, true);  SigDn2[i] = -1; }
      }
   }
}

//+------------------------------------------------------------------+
//|                 Draw Arrow on the Chart                          |
//+------------------------------------------------------------------+
void drawArrow(int i, color theColor, int theCode, bool up)
{
   string name = arrowsIdentifier + ":" + Time[i];   // Create a unique arrow identifier
   double gap = 3.0 * iATR(NULL, 0, 20, i) / 4.0;    // Gap between the arrow and price

   // Create the arrow object and set its properties
   ObjectCreate(name, OBJ_ARROW, 0, Time[i], 0);
   ObjectSet(name, OBJPROP_ARROWCODE, theCode);
   ObjectSet(name, OBJPROP_COLOR, theColor);

   // Position the arrow above/below the price
   if (up)
      ObjectSet(name, OBJPROP_PRICE1, High[i] + gap);
   else
      ObjectSet(name, OBJPROP_PRICE1, Low[i] - gap);
}

//+------------------------------------------------------------------+
//|                 Delete All Arrows from the Chart                 |
//+------------------------------------------------------------------+
void deleteArrows()
{
   string lookFor = arrowsIdentifier + ":";
   int lookForLength = StringLen(lookFor);

   // Loop through all objects and delete those matching the arrow identifier
   for (int i = ObjectsTotal() - 1; i >= 0; i--)
   {
      string objectName = ObjectName(i);
      if (StringSubstr(objectName, 0, lookForLength) == lookFor)
         ObjectDelete(objectName);
   }
}

//+------------------------------------------------------------------+
//|                 Delete Single Arrow by Time                      |
//+------------------------------------------------------------------+
void deleteArrow(datetime time)
{
   string lookFor = arrowsIdentifier + ":" + time;
   ObjectDelete(lookFor);
}

//+------------------------------------------------------------------+
//|                 Clean Point (for trend plotting)                 |
//+------------------------------------------------------------------+
void CleanPoint(int i, double& first[], double& second[])
{
   if ((second[i] != EMPTY_VALUE) && (second[i+1] != EMPTY_VALUE))
      second[i+1] = EMPTY_VALUE;
   else if ((first[i] != EMPTY_VALUE) && (first[i+1] != EMPTY_VALUE) && (first[i+2] == EMPTY_VALUE))
      first[i+1] = EMPTY_VALUE;
}

//+------------------------------------------------------------------+
//|                 Plot Point for Trend                             |
//+------------------------------------------------------------------+
void PlotPoint(int i, double& first[], double& second[], double& from[])
{
   if (first[i+1] == EMPTY_VALUE)
   {
      if (first[i+2] == EMPTY_VALUE)
      {
         first[i] = from[i];
         first[i+1] = from[i+1];
         second[i] = EMPTY_VALUE;
      }
      else
      {
         second[i] = from[i];
         second[i+1] = from[i+1];
         first[i] = EMPTY_VALUE;
      }
   }
   else
   {
      first[i] = from[i];
      second[i] = EMPTY_VALUE;
   }
}

//+------------------------------------------------------------------+
//|                 Timeframe Conversion Helpers                     |
//+------------------------------------------------------------------+
string sTfTable[] = {"M1", "M5", "M15", "M30", "H1", "H4", "D1", "W1", "MN"};
int iTfTable[] = {1, 5, 15, 30, 60, 240, 1440, 10080, 43200};

// Convert string to timeframe integer
int stringToTimeFrame(string tfs)
{
   tfs = stringUpperCase(tfs);
   for (int i = ArraySize(iTfTable) - 1; i >= 0; i--)
      if (tfs == sTfTable[i] || tfs == "" + iTfTable[i]) return(MathMax(iTfTable[i], Period()));
   return(Period());
}

// Convert integer timeframe to string
string timeFrameToString(int tf)
{
   for (int i = ArraySize(iTfTable) - 1; i >= 0; i--)
      if (tf == iTfTable[i]) return(sTfTable[i]);
   return("");
}

// Convert string to uppercase
string stringUpperCase(string str)
{
   string s = str;
   for (int length = StringLen(str) - 1; length >= 0; length--)
   {
      int chars = StringGetChar(s, length);
      if ((chars > 96 && chars < 123) || (chars > 223 && chars < 256))
         s = StringSetChar(s, length, chars - 32);
      else if (chars > -33 && chars < 0)
         s = StringSetChar(s, length, chars + 224);
   }
   return(s);
}
What Is CCI?
The Commodity Channel Index (CCI) is a widely used momentum-based indicator that measures how far a price deviates from its average. Traders often use it to spot overbought (high values) and oversold (low values) conditions in the market. When prices move too far above or below the average, the market is considered “overextended” in one direction, signaling a potential reversal or correction.
Multi-Timeframe (MTF) Functionality
One of the standout features of the Alice Pro CCI MTF is its multi-timeframe capability. Instead of looking at CCI values for a single timeframe, this indicator allows you to assess CCI levels across different timeframes—all within one chart. This gives a broader market perspective, helping traders make more informed decisions by evaluating the momentum on both shorter and longer timeframes simultaneously.
How the Indicator Works
Overbought and Oversold Levels
The indicator uses predefined overbought and oversold levels set at +100 and -100, respectively. When the CCI value crosses above +100, the market is considered overbought, indicating that a downward correction could be imminent. Conversely, when the CCI falls below -100, the market is oversold, which may signal an upward reversal.
These thresholds are standard for CCI, but in this indicator, they are customizable. You can adjust the overbought and oversold levels based on your trading strategy or market conditions.
Trend Detection
The Alice Pro CCI MTF v1.2 not only highlights overbought and oversold zones but also tracks trend direction. When the CCI value rises above the overbought level, it can signal an uptrend, and when it falls below the oversold level, it indicates a downtrend. The indicator tracks these changes and adjusts the plotted lines to represent different phases of the market trend.
Arrow Signals for Zone Entry and Exit
A unique feature of this indicator is its arrow system. The Alice Pro CCI MTF places arrows on the chart whenever the CCI enters or exits the overbought or oversold zones. These arrows serve as a visual cue for traders, marking key areas where the trend might be reversing.
- Entry Arrows: These appear when the market enters overbought or oversold conditions, helping you identify when a trend might be starting.
- Exit Arrows: These are drawn when the market exits these zones, indicating that the trend could be weakening or reversing.
Both the entry and exit arrows are customizable. You can choose to enable or disable them based on your trading preferences, and even modify their colors to match your chart setup.
Smoothness and Smoothing Phase
To enhance readability, the indicator smooths the CCI line using a customizable smoothing method. This makes the line less erratic and easier to interpret, especially in volatile markets. The smoothing phase and smoothing length are adjustable, so you can fine-tune how smooth or responsive you want the CCI line to be.
- Smoothing Length: This controls how many data points are averaged, helping to reduce noise in the CCI values.
- Smoothing Phase: This parameter allows further fine-tuning of the smoothness, impacting how the CCI reacts to price changes.
Non-Repainting Feature
One of the key aspects of the Alice Pro CCI MTF is that it is non-repainting. This means that once the indicator plots a signal or draws an arrow, it will not change afterward. Non-repainting indicators are highly valued in the trading community because they provide stable and reliable signals. You can trust that the indicator’s past behavior won’t be altered, which is crucial for backtesting strategies and making real-time trading decisions.
Customizability of Visual Elements
This indicator is highly customizable. Here are some elements you can modify to suit your preferences:
- Arrow Colors: Choose different colors for upward and downward arrows.
- Arrow Visibility: Toggle the arrows on or off for a cleaner chart.
- CCI Line Colors: Customize the colors used for the CCI plot to make it visually distinct.
- Overbought and Oversold Line Colors: Set specific colors for the overbought and oversold levels to highlight these key areas on your chart.
This level of customization makes it easier to tailor the indicator to your unique trading style.
How the Indicator Can Be Used
Here are some of the ways the Alice Pro CCI MTF can be incorporated into a trading strategy:
Identifying Market Reversals
The indicator’s overbought and oversold signals, combined with the arrows, can help traders spot potential market reversals. When an entry arrow appears, it may signal a new trend, while an exit arrow could suggest the trend is weakening.
Confirming Trend Direction
Since the indicator tracks CCI across multiple timeframes, it can be used to confirm trends. For example, if the CCI indicates an overbought condition in both the 1-hour and 4-hour timeframes, it could strengthen the case for a reversal.
Zone Entry and Exit Strategy
Some traders may prefer to enter or exit trades when the market moves into overbought or oversold zones. The arrows provide a visual confirmation that can be useful for such a strategy.
Important Considerations
While the Alice Pro CCI MTF offers useful insights into market conditions, it’s important to remember that no indicator should be used in isolation. Indicators like this one are best used alongside other forms of analysis, such as price action, support and resistance levels, or volume analysis.
Additionally, just because the CCI enters overbought or oversold levels doesn’t guarantee an immediate reversal. Markets can remain in these conditions for extended periods, so combining this indicator with other tools can help you avoid false signals.
Final Thoughts
The Alice Pro CCI MTF v1.2 (Non-Repaint) is a robust tool for traders who want to keep an eye on momentum across multiple timeframes while using a classic indicator like the CCI. Its combination of overbought/oversold levels, arrows for entry and exit signals, and non-repainting behavior provides clarity and reliability. If you’re looking for an indicator that gives you a broader view of the market by assessing multiple timeframes, this could be a valuable addition to your trading toolbox.