The Fluxon Trend Signal V2 (Non-Repaint) is a trading indicator designed to help users identify potential market trends by analyzing historical price data. With its dual signal representation—indicating both bullish and bearish movements—this indicator offers clear visual cues on trading charts. The non-repainting feature ensures that once signals are generated, they remain fixed, allowing traders to make informed decisions based on past data without second-guessing earlier signals. By adjusting various parameters, users can tailor the indicator to their specific trading styles and preferences, enhancing their overall trading experience.
#property indicator_chart_window
#property indicator_buffers 2
#property indicator_plots 2
// Parameters for the bearish indicator
#property indicator_type1 DRAW_ARROW
#property indicator_color1 clrRed
#property indicator_width1 4
#property indicator_label1 "Silver Sell"
// Parameters for the bullish indicator
#property indicator_type2 DRAW_ARROW
#property indicator_color2 clrLime
#property indicator_width2 4
#property indicator_label2 "Silver Buy"
// Input parameters for the indicator
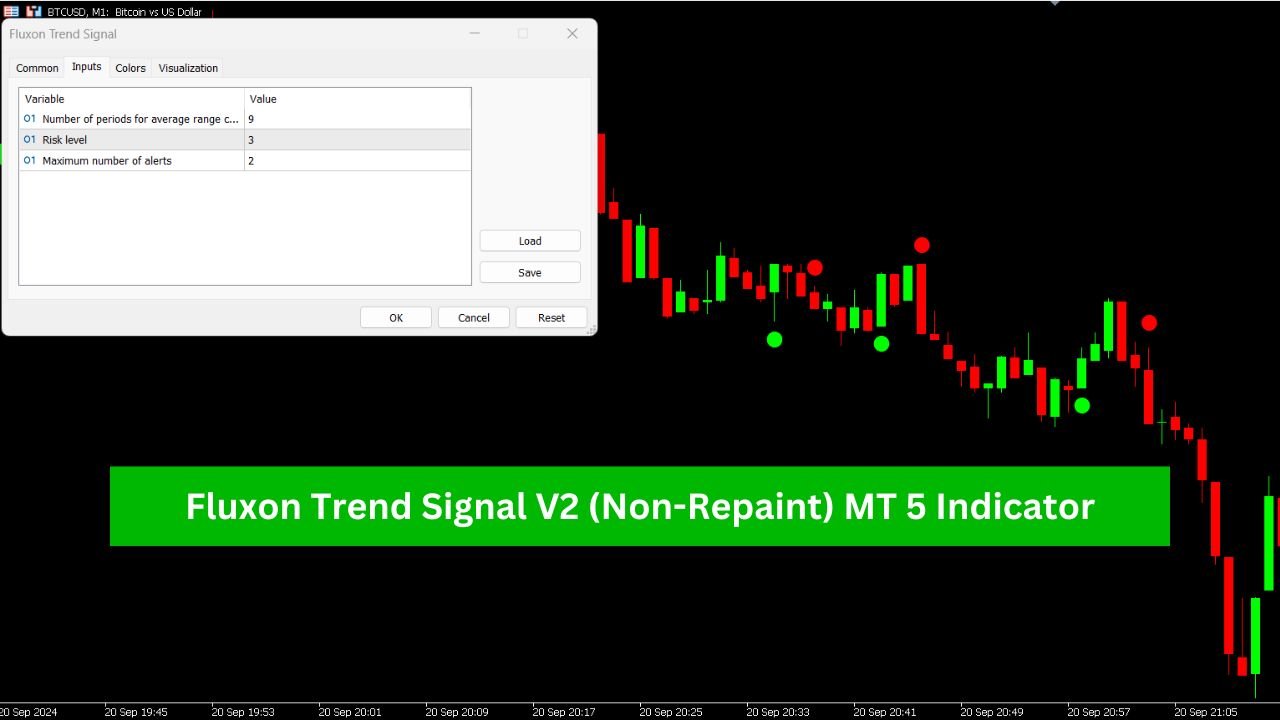
input int SSP = 9; // Number of periods for average range calculation
input int RISK = 3; // Risk level
input int NumberofAlerts = 2; // Maximum number of alerts
// Dynamic arrays for indicator buffers
double SellBuffer[];
double BuyBuffer[];
// Local variables
int K;
int counter = 0;
bool old, uptrend_;
// Variable to mark the starting bar for calculations
int StartBars;
//+------------------------------------------------------------------+
//| Custom indicator initialization function |
//+------------------------------------------------------------------+
void OnInit()
{
StartBars = SSP + 1; // Initialize the starting bar
// Initialize SellBuffer
SetIndexBuffer(0, SellBuffer, INDICATOR_DATA);
PlotIndexSetInteger(0, PLOT_DRAW_BEGIN, StartBars);
PlotIndexSetString(0, PLOT_LABEL, "Silver Sell");
PlotIndexSetInteger(0, PLOT_ARROW, 108);
ArraySetAsSeries(SellBuffer, true);
// Initialize BuyBuffer
SetIndexBuffer(1, BuyBuffer, INDICATOR_DATA);
PlotIndexSetInteger(1, PLOT_DRAW_BEGIN, StartBars);
PlotIndexSetString(1, PLOT_LABEL, "Silver Buy");
PlotIndexSetInteger(1, PLOT_ARROW, 108);
ArraySetAsSeries(BuyBuffer, true);
// Set indicator display precision
IndicatorSetInteger(INDICATOR_DIGITS, _Digits);
string short_name = "SilverTrend_Signal"; // Indicator name
IndicatorSetString(INDICATOR_SHORTNAME, short_name);
}
//+------------------------------------------------------------------+
//| Custom indicator iteration function |
//+------------------------------------------------------------------+
int OnCalculate(const int rates_total,
const int prev_calculated,
const datetime &time[],
const double &open[],
const double &high[],
const double &low[],
const double &close[],
const long &tick_volume[],
const long &volume[],
const int &spread[])
{
if (rates_total < StartBars) return 0; // Ensure enough bars are available
int limit;
double Range, AvgRange, smin, smax, SsMax, SsMin, price;
bool uptrend;
// Calculate the number of data points to copy
if (prev_calculated > rates_total || prev_calculated <= 0) // First calculation
{
K = 33 - RISK;
limit = rates_total - StartBars; // Calculate all bars
}
else
{
limit = rates_total - prev_calculated; // Calculate new bars
}
ArraySetAsSeries(high, true);
ArraySetAsSeries(low, true);
ArraySetAsSeries(close, true);
uptrend = uptrend_; // Restore previous uptrend state
// Main loop to calculate the indicator
for (int bar = limit; bar >= 0; bar--)
{
if (rates_total != prev_calculated && bar == 0)
{
uptrend_ = uptrend; // Store uptrend state for the first bar
}
Range = 0;
AvgRange = 0;
for (int iii = bar; iii <= bar + SSP; iii++)
AvgRange += MathAbs(high[iii] - low[iii]);
Range = AvgRange / (SSP + 1); // Average range calculation
SsMax = low[bar];
SsMin = close[bar];
for (int kkk = bar; kkk <= bar + SSP - 1; kkk++)
{
price = high[kkk];
if (SsMax < price) SsMax = price;
price = low[kkk];
if (SsMin >= price) SsMin = price;
}
smin = SsMin + (SsMax - SsMin) * K / 100;
smax = SsMax - (SsMax - SsMin) * K / 100;
SellBuffer[bar] = 0;
BuyBuffer[bar] = 0;
if (close[bar] < smin) uptrend = false;
if (close[bar] > smax) uptrend = true;
// Generate buy signal
if (uptrend != old && uptrend == true)
{
BuyBuffer[bar] = low[bar] - Range * 0.5;
if (bar == 0 && counter <= NumberofAlerts)
{
Alert("Silver Trend ", EnumToString(Period()), " ", Symbol(), " BUY");
counter++;
}
else counter = 0;
}
// Generate sell signal
if (uptrend != old && uptrend == false)
{
SellBuffer[bar] = high[bar] + Range * 0.5;
if (bar == 0 && counter <= NumberofAlerts)
{
Alert("Silver Trend ", EnumToString(Period()), " ", Symbol(), " SELL");
counter++;
}
else counter = 0;
}
if (bar > 0) old = uptrend; // Update old trend state
}
return rates_total; // Return the total number of processed bars
}
//+------------------------------------------------------------------+
What is the Fluxon Trend Signal Indicator?
The Fluxon Trend Signal is a visual indicator that appears on trading charts, providing insights into market trends. By analyzing price movements, it aims to highlight when a security might be trending upwards or downwards. This can assist traders in making more informed decisions.
Key Features of the Indicator
- Dual Signal Representation: The Fluxon Trend Signal uses two distinct signals to convey information:
- Bullish (Buy) Signals: Indicated by a green arrow, suggesting potential upward price movement.
- Bearish (Sell) Signals: Represented by a red arrow, indicating possible downward price action.
- Customizable Parameters: Users can adjust the parameters to suit their trading style and preferences. This includes settings like the number of periods for trend calculation and the risk level for alerts.
- Dynamic Alerts: The indicator is equipped to send alerts based on the defined settings, notifying traders when specific conditions are met.
How Does the Fluxon Trend Signal Work?
Calculating Market Trends
At its core, the Fluxon Trend Signal analyzes historical price data to determine current market trends. It does this by assessing the relationship between high, low, and closing prices over a specified number of periods. Here’s a breakdown of its functionality:
- Average Range Calculation: The indicator calculates the average price range over a designated period. This helps it understand market volatility and set appropriate levels for buy and sell signals.
- Identifying Support and Resistance Levels: By evaluating the highest and lowest prices during this period, the indicator determines key levels that traders often look for when making decisions.
- Trend Detection: Based on the calculated ranges, the Fluxon Trend Signal assesses whether the market is in an uptrend (rising prices) or downtrend (falling prices). This determination is crucial for generating the buy and sell signals.
Signal Generation
Once the indicator has analyzed the price data, it generates signals based on predefined criteria:
- Buy Signal: When the closing price rises above a calculated resistance level, a green arrow is displayed on the chart, signaling potential upward movement.
- Sell Signal: Conversely, when the closing price drops below a support level, a red arrow appears, indicating potential downward movement.
These signals serve as visual cues for traders, helping them decide when to enter or exit trades.
Customization and Alerts
Adjustable Settings
One of the advantages of the Fluxon Trend Signal is its flexibility. Traders can customize various settings to align with their specific strategies. For example, adjusting the number of periods can make the indicator more sensitive to market changes or less so, depending on the trader’s preference.
Alert System
The alert feature is designed to keep traders informed without the need for constant monitoring. When the indicator detects a significant change that warrants attention, it sends a notification. This can be particularly helpful for traders who may not be able to watch the market at all times.
Conclusion
The Fluxon Trend Signal is a valuable tool for traders looking to enhance their decision-making process. By providing clear visual signals based on historical price analysis, it helps identify potential market trends and trading opportunities. Understanding how this indicator functions can empower traders to incorporate it effectively into their trading strategies. Remember, while indicators can provide insights, it’s always essential to consider them in the context of broader market analysis and personal risk tolerance.