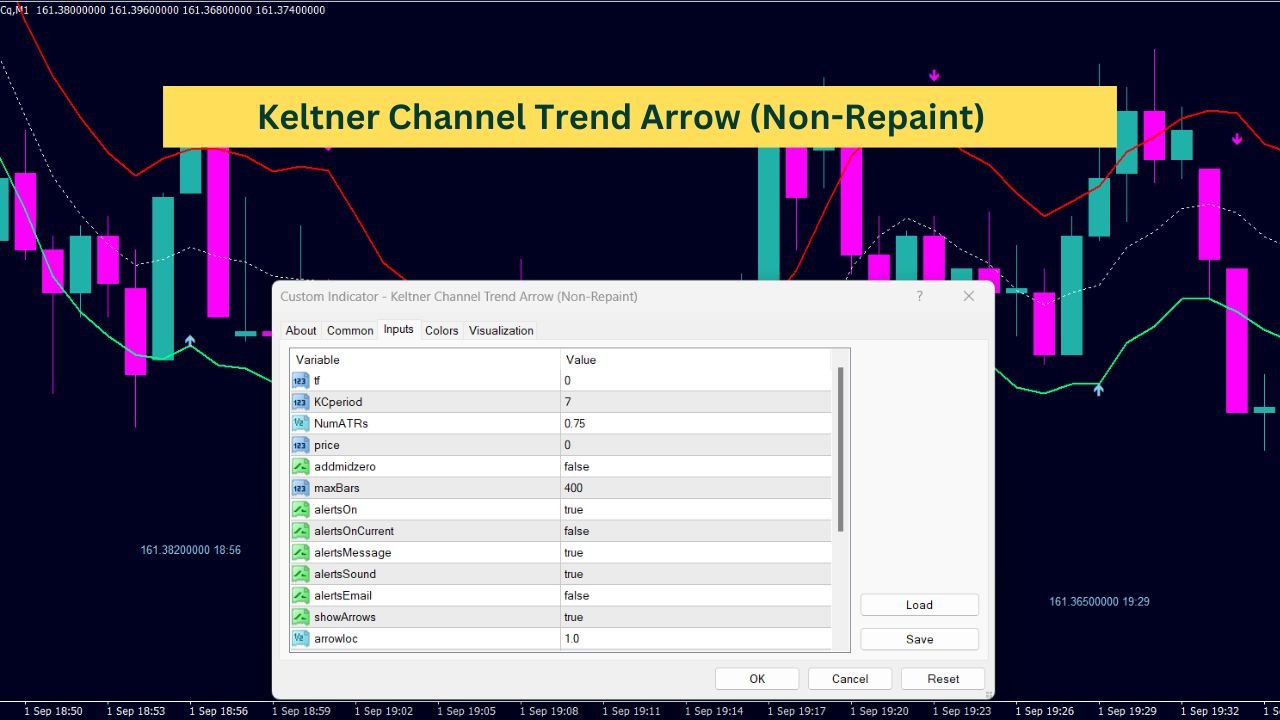
The Keltner Channel Trend Arrow (Non-Repaint) indicator is designed to help visualize market trends by plotting upper, middle, and lower bands on the price chart. It identifies potential trend changes by using arrows and values to mark significant price movements relative to these bands. This indicator offers a clear, systematic approach to analyzing market behavior, without recalculating past data, ensuring that the signals it provides remain consistent over time.
// Indicator settings and properties
#property indicator_chart_window
#property indicator_buffers 4
#property indicator_color1 Magenta
#property indicator_color2 Blue
#property indicator_color3 Magenta
#property indicator_style1 2
#property indicator_style2 2
#property indicator_style3 2

// External inputs
extern int tf = 0;                 // Timeframe for calculations
extern int KCperiod = 7;           // Keltner Channel period
extern double NumATRs = 0.75;      // Number of ATRs for channel width
extern int price = 0;              // Price type (0-6; 4 = median)
extern bool addmidzero = false;    // Add zero trend for middle band
extern int maxBars = 400;          // Max bars to process

// Alert settings
extern bool alertsOn = true;            // Enable alerts
extern bool alertsOnCurrent = false;    // Alerts on current bar
extern bool alertsMessage = true;       // Display message alerts
extern bool alertsSound = true;         // Play sound alerts
extern bool alertsEmail = false;        // Send email alerts

// Arrow settings
extern bool showArrows = true;           // Show arrows on chart
extern double arrowloc = 1.0;            // Arrow location factor
extern string arrowsIdentifier = "KC8arr";  // Arrow identifier
extern color ArrowUpColor = SkyBlue;     // Color for up arrows
extern color ArrowDownColor = Magenta;   // Color for down arrows

// Value settings
extern bool showValues = true;           // Show values on chart
extern double Valueloc = 0.4;            // Value location factor
extern string valueIdentifier = "KC8val";  // Value identifier
extern color txtUpColor = SkyBlue;       // Color for up values
extern color txtDownColor = Magenta;     // Color for down values

// Indicator buffers
double upper[], middle[], lower[], trend[];
datetime prevtime = 0;

//+------------------------------------------------------------------+
//| Custom indicator initialization function                         |
//+------------------------------------------------------------------+
int init() {
   IndicatorBuffers(4);

   // Setup upper band
   SetIndexStyle(0, DRAW_LINE);
   SetIndexShift(0, 0);
   SetIndexDrawBegin(0, 0);
   SetIndexBuffer(0, upper);

   // Setup middle band
   SetIndexStyle(1, DRAW_LINE);
   SetIndexShift(1, 0);
   SetIndexDrawBegin(1, 0);
   SetIndexBuffer(1, middle);

   // Setup lower band
   SetIndexStyle(2, DRAW_LINE);
   SetIndexShift(2, 0);
   SetIndexDrawBegin(2, 0);
   SetIndexBuffer(2, lower);

   // Setup trend buffer
   SetIndexBuffer(3, trend);

   // Set indicator names and labels
   IndicatorShortName("RK-KCv6-wtxt-Zo-trend_arrows (" + KCperiod + ") " + DoubleToStr(NumATRs, 2) + ")");
   SetIndexLabel(0, "KC-upper");
   SetIndexLabel(1, "KC-middle");
   SetIndexLabel(2, "KC-lower");
   SetIndexLabel(3, "KC-trend(" + KCperiod + ") " + DoubleToStr(NumATRs, 2) + ")");

   return (0);
}

//+------------------------------------------------------------------+
//| Custom indicator deinitialization function                       |
//+------------------------------------------------------------------+
int deinit() {
   // Delete arrows and values on deinitialization
   if (showArrows) deleteArrows();
   if (showValues) deleteValues();

   return (0);
}

//+------------------------------------------------------------------+
//| Custom indicator iteration function                              |
//+------------------------------------------------------------------+
int start() {
   int limit;
   int counted_bars = IndicatorCounted();
   if (counted_bars < 0) return (-1);
   if (counted_bars > 0) counted_bars--;
   limit = Bars - counted_bars;
   if (limit > maxBars) limit = maxBars;

   double avg;
   for (int x = limit; x >= 0; x--) {
      middle[x] = iMA(NULL, tf, KCperiod, 0, MODE_SMA, price, x);
      avg = findAvg(KCperiod, x);
      upper[x] = middle[x] + (avg * NumATRs);
      lower[x] = middle[x] - (avg * NumATRs);
      trend[x] = trend[x + 1];

      // Determine trend direction
      if (Close[x] >= upper[x]) trend[x] = 1;
      if (Close[x] <= lower[x]) trend[x] = -1;
      if (addmidzero && Close[x] <= upper[x] && Close[x] >= lower[x]) trend[x] = 0;

      // Manage arrows and values
      if (showArrows) manageArrow(x);
      if (showValues) manageValue(x);
   }

   manageAlerts();
   return (0);
}

//+------------------------------------------------------------------+
//| Alert management function                                        |
//+------------------------------------------------------------------+
void manageAlerts() {
   if (alertsOn) {
      int whichBar = alertsOnCurrent ? 0 : 1;

      if (Close[whichBar] > upper[whichBar] && prevtime != Time[0]) doAlert(whichBar, "up", 1);
      if (Close[whichBar] < lower[whichBar] && prevtime != Time[0]) doAlert(whichBar, "down", -1);
   }
}

//+------------------------------------------------------------------+
//| Alert triggering function                                        |
//+------------------------------------------------------------------+
void doAlert(int forBar, string doWhat, double value) {
   static string previousAlert = "nothing";
   static datetime previousTime;
   string message;

   if (previousAlert != doWhat) {
      previousAlert = doWhat;
      previousTime = Time[forBar];

      message = StringConcatenate(
         Symbol(), " tf-", (Period()), " at ",
         TimeToStr(TimeLocal(), TIME_SECONDS), " RK-KC Alert ",
         "  Bid -", DoubleToStr(Bid, Digits), "  Ask -", DoubleToStr(Ask, Digits),
         "  ", DoubleToStr(value, 2), " KC Breakout-", doWhat
      );

      if (alertsMessage) Alert(message);
      if (alertsEmail) SendMail(StringConcatenate(Symbol(), "Keltner breakout "), message);
      if (alertsSound) PlaySound("boxing_bell_multiple.wav");
      if (alertsSound) PlaySound("gun_44mag_11.wav");
   }
}

//+------------------------------------------------------------------+
//| Arrow management function                                        |
//+------------------------------------------------------------------+
void manageArrow(int x) {
   if (showArrows) {
      double dist = iATR(NULL, 0, 20, x) / arrowloc;
      string name = arrowsIdentifier + ":" + Time[x];
      ObjectDelete(name);

      if (trend[x] != trend[x + 1]) {
         if (trend[x] == 1) {
            ObjectCreate(name, OBJ_ARROW, 0, Time[x], Low[x] - dist);
            ObjectSet(name, OBJPROP_ARROWCODE, 233);
            ObjectSet(name, OBJPROP_COLOR, ArrowUpColor);
         } else if (trend[x] == -1) {
            ObjectCreate(name, OBJ_ARROW, 0, Time[x], High[x] + dist);
            ObjectSet(name, OBJPROP_ARROWCODE, 234);
            ObjectSet(name, OBJPROP_COLOR, ArrowDownColor);
         }
      }
   }
}

//+------------------------------------------------------------------+
//| Value management function                                        |
//+------------------------------------------------------------------+
void manageValue(int x) {
   if (showValues) {
      double dist = iATR(NULL, 0, 20, x) / Valueloc;
      string on = valueIdentifier + ":" + Time[x];
      ObjectDelete(on);

      if (trend[x] != trend[x + 1]) {
         if (trend[x] == 1) {
            ObjectCreate(on, OBJ_TEXT, 0, Time[x], Low[x] - dist);
            ObjectSetText(on, DoubleToStr(Close[x], Digits) + " " + TimeToStr(Time[x], TIME_MINUTES), 8, "Arial", txtUpColor);
         } else if (trend[x] == -1) {
            ObjectCreate(on, OBJ_TEXT, 0, Time[x], High[x] + dist);
            ObjectSetText(on, DoubleToStr(Close[x], Digits) + " " + TimeToStr(Time[x], TIME_MINUTES), 8, "Arial", txtDownColor);
         }
      }
   }
}

//+------------------------------------------------------------------+
//| Function to delete all arrows                                    |
//+------------------------------------------------------------------+
void deleteArrows() {
   string lookFor = arrowsIdentifier + ":";
   int lookForLength = StringLen(lookFor);
   for (int i = ObjectsTotal() - 1; i >= 0; i--) {
      string objectName = ObjectName(i);
      if (StringSubstr(objectName, 0, lookForLength) == lookFor) ObjectDelete(objectName);
   }
}

//+------------------------------------------------------------------+
//| Function to delete a specific arrow                              |
//+------------------------------------------------------------------+
void deleteArrow(datetime time) {
   string lookFor = arrowsIdentifier + ":" + time;
   ObjectDelete(lookFor);
}

//+------------------------------------------------------------------+
//| Function to delete all value labels                              |
//+------------------------------------------------------------------+
void deleteValues() {
   string lookFor = valueIdentifier + ":";
   int lookForLength = StringLen(lookFor);
   for (int i = ObjectsTotal() - 1; i >= 0; i--) {
      string objectName = ObjectName(i);
      if (StringSubstr(objectName, 0, lookForLength) == lookFor) ObjectDelete(objectName);
   }
}

//+------------------------------------------------------------------+
//| Function to delete a specific value label                        |
//+------------------------------------------------------------------+
void deleteValues(datetime time) {
   string lookFor = valueIdentifier + ":" + time;
   ObjectDelete(lookFor);
}

//+------------------------------------------------------------------+
//| Function to calculate the average range                          |
//+------------------------------------------------------------------+
double findAvg(int KCperiod, int shift) {
   double sum = 0;
   for (int x = shift; x < (shift + KCperiod); x++) {
      sum += High[x] - Low[x];
   }
   sum = sum / KCperiod;
   return (sum);
}
What Does This Indicator Do?
This indicator calculates three key levels on your price chart:
- Upper Band
- Middle Band
- Lower Band
These bands are used to determine the general direction of the market. The middle band is essentially a moving average, while the upper and lower bands are calculated by adding and subtracting a multiple of the average true range (ATR) from the middle band.
Key Components
Let’s break down the important parts of the indicator:
Bands Calculation
The core of this indicator lies in the calculation of the upper, middle, and lower bands. The middle band is calculated using a simple moving average of the price over a specified period. The upper and lower bands are derived by adding and subtracting a certain multiple of the ATR, which measures market volatility, to and from the middle band.
Trend Identification
The indicator also includes logic to determine the market trend:
- Uptrend: When the closing price is above the upper band.
- Downtrend: When the closing price is below the lower band.
- Neutral Trend: When the closing price is between the upper and lower bands, if the option to show a zero trend is enabled.
These trends are stored in an array and can be visually represented on the chart.
Arrows and Values on the Chart
The indicator has options to display arrows and values on the chart, which can help traders quickly identify when the market crosses the upper or lower bands:
- Arrows: Indicate when the market has crossed above the upper band (uptrend) or below the lower band (downtrend).
- Values: Display the closing price and time at each significant point on the chart.
Alerts and Notifications
To keep you updated, the indicator can send alerts when a crossover occurs. These alerts can be configured to trigger on different events, such as when the price crosses the upper or lower band.
- Message Alerts: Pop-up notifications on the screen.
- Sound Alerts: Plays a sound file to notify of the event.
- Email Alerts: Sends an email with the relevant information.
Customization Options
This indicator is highly customizable. You can adjust:
- Timeframe: Which period the indicator should calculate over.
- Period: The length of the moving average used for the middle band.
- ATR Multiplier: How much the ATR is multiplied to calculate the upper and lower bands.
- Colors and Styles: For the bands, arrows, and text.
- Arrow and Value Positioning: To determine where they should appear on the chart.
How the Indicator Works
Initialization
The indicator starts by setting up its buffers, which are arrays that hold the values for the upper, middle, and lower bands as well as the trend. The buffers are crucial for storing calculated values and displaying them on the chart.
Main Logic
During each tick (i.e., whenever the price updates), the indicator recalculates the values for the bands and the trend for a specified number of bars back from the current price. It then checks if the price has crossed any of these bands and updates the trend accordingly.
Visual Elements
If enabled, the indicator will draw arrows and text labels on the chart based on the trend direction. These visual elements can be particularly useful for spotting trend changes at a glance.
Alert Management
The indicator manages alerts by checking if the current price has crossed the bands and whether this crossing is happening on the current bar or a previous one. If the conditions are met, it triggers the appropriate alert, helping you stay informed about potential trend shifts.
Deleting Objects
To keep the chart clean, the indicator also includes functions to delete old arrows and text labels. This ensures that only the most relevant information is displayed, reducing clutter on your chart.
Final Thoughts
This indicator is a powerful tool for analyzing market trends through visual cues and alerts. By plotting the upper, middle, and lower bands on your chart and providing additional features like arrows, values, and alerts, it offers a comprehensive way to stay on top of market movements. Remember, while the indicator offers a systematic way to monitor trends, it’s essential to understand its logic and behavior before relying on it in your trading decisions.