The Nexor Prime v1.2 (Non-Repaint) is a custom technical analysis tool designed to help traders identify potential buying and selling points on a price chart. This indicator primarily utilizes moving averages to track trends and incorporates volatility measures like the Average True Range (ATR) for adjusting signal placement. It generates visual signals, such as arrows, to highlight possible market entries. The non-repaint feature ensures that once signals appear, they remain fixed, providing a consistent visual reference for traders.
#property indicator_chart_window
#property indicator_buffers 2 // Two indicator buffers are used
#property indicator_plots 2 // Two graphical plots are used
//--- Constants for indicator recalculation
#define RESET 0
//--- Indicator parameters for Bearish signals
#property indicator_type1 DRAW_ARROW // Draw arrows for Bearish signals
#property indicator_color1 clrDeepPink // Use deep pink color for Bearish signals
#property indicator_width1 4 // Set the width of the Bearish signal line
#property indicator_label1 "simple_trading_system Sell"
//--- Indicator parameters for Bullish signals
#property indicator_type2 DRAW_ARROW // Draw arrows for Bullish signals
#property indicator_color2 clrLightSeaGreen // Use light sea green color for Bullish signals
#property indicator_width2 4 // Set the width of the Bullish signal line
#property indicator_label2 "simple_trading_system Buy"
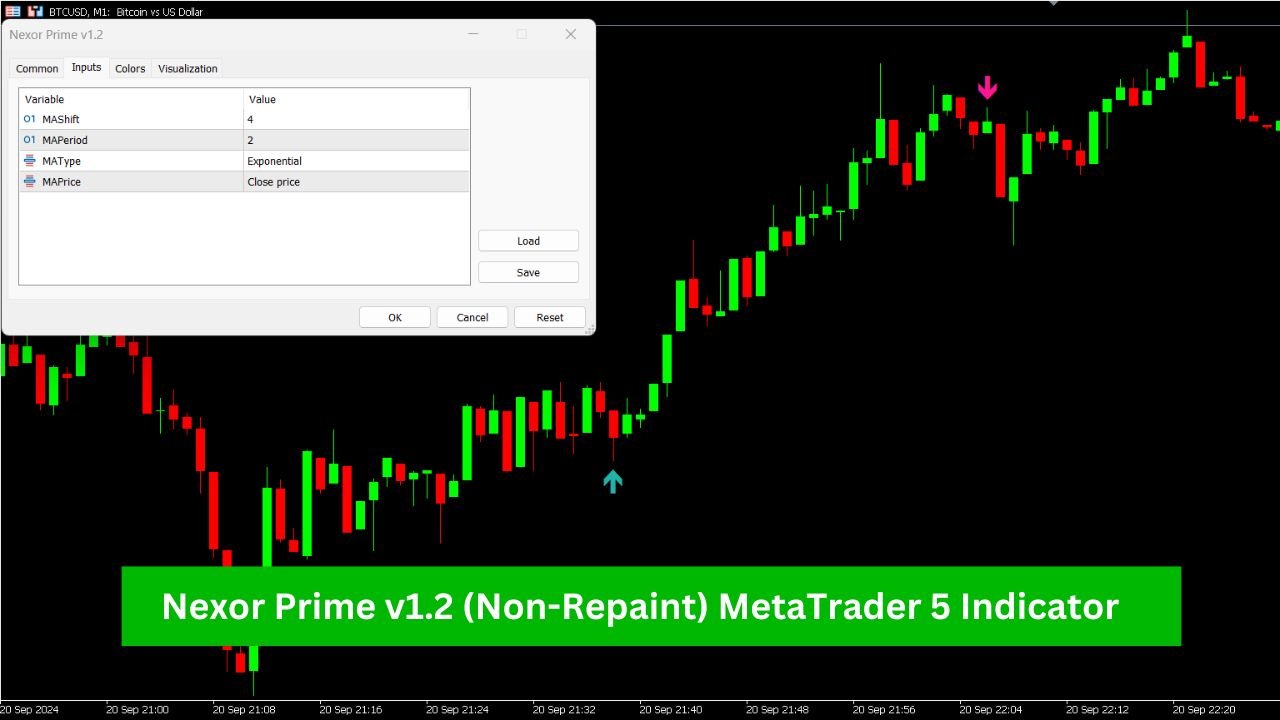
//--- Input parameters
input uint MAShift = 4; // Shift value for moving average
input uint MAPeriod = 2; // Period for moving average
input ENUM_MA_METHOD MAType = MODE_EMA; // Type of moving average
input ENUM_APPLIED_PRICE MAPrice = PRICE_CLOSE; // Applied price for the moving average
//--- Buffers for the indicator
double SellBuffer[]; // Buffer for Bearish signals
double BuyBuffer[]; // Buffer for Bullish signals
//--- Handles for indicators
int MA_Handle, ATR_Handle;
int min_rates_total;
//--- Arrays for calculation
int Count[], MAShift_, SumPeriod;
double Ma[];
//+------------------------------------------------------------------+
//| Recalculates the position of the newest element in an array |
//+------------------------------------------------------------------+
void Recount_ArrayZeroPos(int &CoArr[], int Size)
{
int numb, Max1, Max2;
static int count = 1;
Max2 = Size;
Max1 = Max2 - 1;
count--;
if (count < 0) count = Max1;
for (int iii = 0; iii < Max2; iii++)
{
numb = iii + count;
if (numb > Max1) numb -= Max2;
CoArr[iii] = numb;
}
}
//+------------------------------------------------------------------+
//| Custom indicator initialization function |
//+------------------------------------------------------------------+
int OnInit()
{
int ATR_Period = 15; // ATR period
min_rates_total = int(MathMax(ATR_Period, MAPeriod + MAShift));
//--- Get ATR indicator handle
ATR_Handle = iATR(NULL, 0, ATR_Period);
if (ATR_Handle == INVALID_HANDLE)
{
Print("Failed to get ATR handle");
return(INIT_FAILED);
}
//--- Get MA indicator handle
MA_Handle = iMA(NULL, 0, MAPeriod, 0, MAType, MAPrice);
if (MA_Handle == INVALID_HANDLE)
{
Print("Failed to get MA handle");
return(INIT_FAILED);
}
//--- Allocate memory for arrays
MAShift_ = int(MAShift + 1);
SumPeriod = int(MAPeriod + MAShift);
ArrayResize(Count, MAShift_);
ArrayResize(Ma, MAShift_);
ArrayInitialize(Count, 0);
ArrayInitialize(Ma, 0.0);
//--- Convert dynamic arrays into indicator buffers
SetIndexBuffer(0, SellBuffer, INDICATOR_DATA); // Buffer for Sell signals
PlotIndexSetInteger(0, PLOT_DRAW_BEGIN, min_rates_total); // Set drawing start point for Sell buffer
PlotIndexSetInteger(0, PLOT_ARROW, 234); // Set symbol for Sell signals
ArraySetAsSeries(SellBuffer, true); // Index buffer as time series
SetIndexBuffer(1, BuyBuffer, INDICATOR_DATA); // Buffer for Buy signals
PlotIndexSetInteger(1, PLOT_DRAW_BEGIN, min_rates_total); // Set drawing start point for Buy buffer
PlotIndexSetInteger(1, PLOT_ARROW, 233); // Set symbol for Buy signals
ArraySetAsSeries(BuyBuffer, true); // Index buffer as time series
//--- Set precision for indicator display
IndicatorSetInteger(INDICATOR_DIGITS, _Digits);
//--- Set the short name for the indicator
string short_name = "simple_trading_system";
IndicatorSetString(INDICATOR_SHORTNAME, short_name);
return(INIT_SUCCEEDED); // Initialization successful
}
//+------------------------------------------------------------------+
//| Custom indicator iteration function |
//+------------------------------------------------------------------+
int OnCalculate(const int rates_total, const int prev_calculated, const datetime &time[], const double &open[], const double &high[], const double &low[], const double &close[], const long &tick_volume[], const long &volume[], const int &spread[])
{
//--- Check if enough bars are available for calculation
if (BarsCalculated(MA_Handle) < rates_total || BarsCalculated(ATR_Handle) < rates_total || rates_total < min_rates_total)
return(RESET);
int to_copy, limit, bar, sign0;
double MA[], ATR[], ma0, ma1;
static int sign1;
//--- Determine the starting point for calculation
if (prev_calculated > rates_total || prev_calculated <= 0)
{
limit = rates_total - min_rates_total; // Calculate all bars
sign1 = 0;
}
else
{
limit = rates_total - prev_calculated; // Calculate only new bars
}
to_copy = limit + 1;
//--- Copy new data to MA and ATR arrays
if (CopyBuffer(MA_Handle, 0, 0, to_copy, MA) <= 0) return(RESET);
if (CopyBuffer(ATR_Handle, 0, 0, to_copy, ATR) <= 0) return(RESET);
ArraySetAsSeries(MA, true); // Index as time series
ArraySetAsSeries(ATR, true);
ArraySetAsSeries(open, true);
ArraySetAsSeries(high, true);
ArraySetAsSeries(low, true);
ArraySetAsSeries(close, true);
sign0 = sign1;
//--- Main loop for calculation
for (bar = limit; bar >= 0 && !IsStopped(); bar--)
{
BuyBuffer[bar] = 0.0;
SellBuffer[bar] = 0.0;
Ma[Count[0]] = MA[bar];
ma0 = MA[bar];
ma1 = Ma[Count[MAShift]];
//--- Bullish condition
if (sign0 < +1 && ma0 <= ma1 && close[bar] >= close[bar + MAShift] && close[bar] <= close[bar + SumPeriod] && close[bar] < open[bar])
{
BuyBuffer[bar] = low[bar] - ATR[bar] * 3 / 8;
sign0 = +1;
}
//--- Bearish condition
if (sign0 > -1 && ma0 >= ma1 && close[bar] <= close[bar + MAShift] && close[bar] >= close[bar + SumPeriod] && close[bar] > open[bar])
{
SellBuffer[bar] = high[bar] + ATR[bar] * 3 / 8;
sign0 = -1;
}
//--- Recalculate array position for the next iteration
if (bar)
{
Recount_ArrayZeroPos(Count, MAShift_);
sign1 = sign0;
}
}
return(rates_total); // Return the total number of rates
}
What Is the Nexor Prime Indicator?
The Nexor Prime Indicator is a custom-built technical analysis tool aimed at spotting potential buying and selling opportunities on a chart. The indicator does this by using moving averages (MAs), alongside additional data like the Average True Range (ATR), to determine whether the market is in a bullish (buy) or bearish (sell) condition.
What makes the Nexor Prime unique is that it plots arrows on the chart—green for buy signals and pink for sell signals. These arrows are meant to offer a visual cue when certain conditions in the price movement and underlying data align.
How the Nexor Prime Indicator Works
At its core, Nexor Prime revolves around two essential components:
- Moving Average (MA): This is the primary driver of how the indicator assesses trend direction. It smooths out price data over a specific period, allowing traders to get a clearer sense of whether the price is moving upward or downward.
- Average True Range (ATR): The ATR is used to measure market volatility. In Nexor Prime, this value helps adjust the buy and sell signals, ensuring they react appropriately to changing market conditions.
Key Components of Nexor Prime
Let’s break down the main aspects of the Nexor Prime Indicator:
Buy and Sell Signals
The Nexor Prime generates two types of signals:
- Buy Signal (Green Arrow): A buy signal occurs when the conditions are favorable for entering a long position. The indicator checks whether the market is likely to move upward based on several criteria, such as comparing the current and previous moving average values, as well as the closing price of candles.
- Sell Signal (Pink Arrow): The sell signal appears when the conditions suggest it’s time to go short. The logic behind the sell signal is similar to the buy signal but in reverse, looking for opportunities where the price may move downward.
Moving Average Shifts and Calculations
The Nexor Prime relies heavily on moving averages, which are configured using specific parameters like the period, the shift (how far forward or backward the MA is adjusted), and the applied price (whether the MA is calculated based on the open, close, high, or low price). These moving averages are used to determine trends by comparing the current and previous price levels.
- The current MA value is compared with the shifted MA value (a previous value based on the shift period). This comparison is key to determining whether the market is trending upward or downward.
- The closing price of the market is also used in combination with the MA to ensure the buy or sell signals are triggered based on the most recent data.
ATR and Signal Adjustment
The ATR (Average True Range) plays an important role in determining the placement of buy and sell arrows. It ensures that signals are adjusted based on the market’s volatility:
- For Buy Signals: The green arrow is plotted below the market’s lowest point, adjusted by a fraction of the ATR. This is done to factor in volatility and provide a better sense of entry.
- For Sell Signals: The pink arrow is placed above the market’s high, also adjusted by a fraction of the ATR.
These adjustments allow Nexor Prime to take into account the market’s volatility, helping reduce false signals when conditions are too choppy or unpredictable.
How Signals Are Generated
The process for generating buy and sell signals in the Nexor Prime is straightforward:
- Buy Signal:
- The current moving average (MA) value must be lower than the previous (shifted) MA value.
- The current closing price must be higher than a specific level of previous candles.
- The current price must be in a specific range compared to the open price of the candle.
- Sell Signal:
- The current MA value must be higher than the shifted MA value.
- The current closing price must be lower than a certain range of previous candles.
- The current price must be lower than the candle’s open price.
When these conditions are met, Nexor Prime will plot the corresponding arrow on the chart, indicating a potential entry for traders to consider.
Key Features to Note
- Non-repaint Behavior: Once an arrow is plotted on the chart, it will not change position, which means the signal remains visible after it is generated. This is a non-repaint indicator, giving you the confidence that the signals won’t shift unexpectedly.
- Lag and Recalculation: The Nexor Prime indicator does have some lag, especially when using moving averages with smaller periods. This lag can be typical with MAs since they use past price data to smooth the price curve. The indicator also recalculates when new bars are added, adjusting the most recent signals based on updated market conditions.
When to Use the Nexor Prime Indicator
The Nexor Prime Indicator can be helpful in markets where identifying clear trends is crucial. It performs best in situations where the market is trending, as the buy and sell signals are based on moving average crossovers and other price-related conditions.
However, in sideways markets or markets with extreme volatility, the indicator may produce fewer reliable signals. Traders should be mindful of these limitations and use the Nexor Prime alongside other tools to confirm the market’s overall direction.
Final Thoughts
The Nexor Prime Indicator offers traders a straightforward method to spot potential buy and sell opportunities on a chart. By combining moving averages and market volatility measures like the ATR, it provides signals that traders can use to gauge market conditions. While it is not immune to market noise or lag, it gives a clear visual representation of possible market turns. Remember, this indicator, like any other, should be part of a broader trading strategy and not used in isolation.