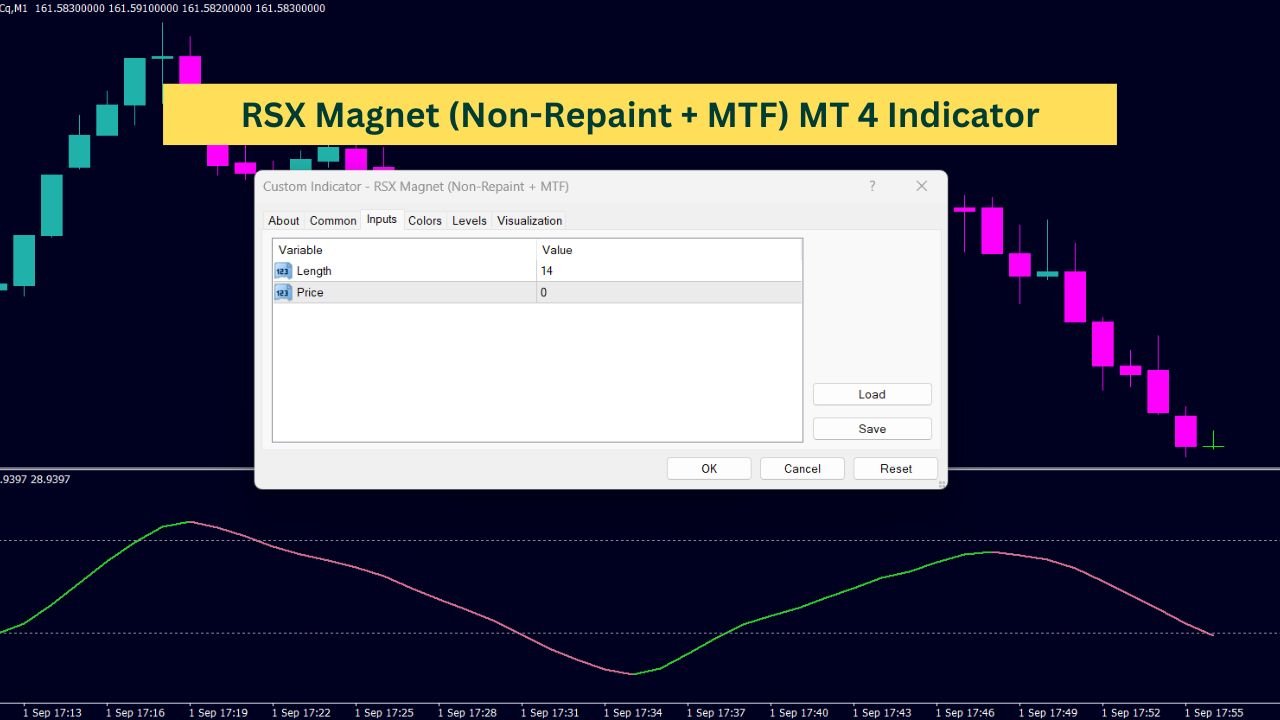
The RSX Magnet (Non-Repaint + MTF) is a technical indicator designed to assist traders in analyzing market trends. This indicator builds upon the principles of the traditional RSX (Relative Strength Index X) by incorporating features that aim to enhance its usability across different timeframes. As a non-repaint tool, it ensures that past signals remain unchanged, providing a stable reference for historical analysis. Additionally, its multi-timeframe (MTF) functionality allows it to be used effectively across various chart timeframes, offering a flexible approach to market analysis. The RSX Magnet aims to help traders identify potential trends and trading opportunities based on momentum and strength without altering past data points.
#property indicator_separate_window
#property indicator_buffers 3
#property indicator_color1  LimeGreen
#property indicator_color2  PaleVioletRed
#property indicator_color3  PaleVioletRed
#property indicator_width1  2
#property indicator_width2  2
#property indicator_width3  2
#property indicator_minimum 0
#property indicator_maximum 100
#property indicator_level1  70
#property indicator_level2  30
#property indicator_levelcolor DarkGray

// External parameters
extern int Length = 14;       // RSX length
extern int Price  = PRICE_CLOSE; // Price type for calculation
extern ENUM_TIMEFRAMES TimeFrame = PERIOD_H1; // Timeframe for MTF

// Indicator buffers
double rsx[];    // RSX values
double rsxDa[];  // RSX Da values
double rsxDb[];  // RSX Db values
double slope[];  // Slope values

//-------------------------------------------------------------------
// Initialization function
//-------------------------------------------------------------------
int OnInit()
{
    IndicatorBuffers(4);
    SetIndexBuffer(0, rsx);
    SetIndexBuffer(1, rsxDa);
    SetIndexBuffer(2, rsxDb);
    SetIndexBuffer(3, slope);
    IndicatorShortName("RSX (" + Length + ")");
    return (INIT_SUCCEEDED);
}

//-------------------------------------------------------------------
// Deinitialization function
//-------------------------------------------------------------------
void OnDeinit(const int reason) {}

//-------------------------------------------------------------------
// Main calculation function
//-------------------------------------------------------------------
double wrkBuffer[][13]; // Working buffer for calculations

void OnTick()
{
    int i, r, counted_bars = IndicatorCounted();

    // Check for errors
    if (counted_bars < 0) return;
    if (counted_bars > 0) counted_bars--;

    // Determine the limit for calculation
    int limit = MathMin(Bars - counted_bars, Bars - 1);
    if (ArrayRange(wrkBuffer, 0) != Bars) ArrayResize(wrkBuffer, Bars);

    // Clean previous points if needed
    if (slope[limit] == -1) CleanPoint(limit, rsxDa, rsxDb);

    // RSX calculation parameters
    double Kg = 3.0 / (2.0 + Length);
    double Hg = 1.0 - Kg;

    // Calculate RSX values
    for (i = limit, r = Bars - i - 1; i >= 0; i--, r++)
    {
        wrkBuffer[r][12] = iMA(NULL, TimeFrame, 1, 0, MODE_SMA, Price, i);

        // Skip calculations for the last bar
        if (i == (Bars - 1))
        {
            for (int c = 0; c < 12; c++) wrkBuffer[r][c] = 0;
            continue;
        }

        // RSX calculation logic
        double mom = wrkBuffer[r][12] - wrkBuffer[r - 1][12];
        double moa = MathAbs(mom);

        for (int k = 0; k < 3; k++)
        {
            int kk = k * 2;
            wrkBuffer[r][kk + 0] = Kg * mom + Hg * wrkBuffer[r - 1][kk + 0];
            wrkBuffer[r][kk + 1] = Kg * wrkBuffer[r][kk + 0] + Hg * wrkBuffer[r - 1][kk + 1];
            mom = 1.5 * wrkBuffer[r][kk + 0] - 0.5 * wrkBuffer[r][kk + 1];
            wrkBuffer[r][kk + 6] = Kg * moa + Hg * wrkBuffer[r - 1][kk + 6];
            wrkBuffer[r][kk + 7] = Kg * wrkBuffer[r][kk + 6] + Hg * wrkBuffer[r - 1][kk + 7];
            moa = 1.5 * wrkBuffer[r][kk + 6] - 0.5 * wrkBuffer[r][kk + 7];
        }

        // Update RSX value
        rsx[i] = moa != 0 ? MathMax(MathMin((mom / moa + 1.0) * 50.0, 100.00), 0.00) : 50;

        // Set RSX Da and Db values
        rsxDa[i] = EMPTY_VALUE;
        rsxDb[i] = EMPTY_VALUE;

        // Determine slope and plot points
        if (rsx[i] > rsx[i + 1]) slope[i] = 1;
        if (rsx[i] < rsx[i + 1]) slope[i] = -1;
        if (slope[i] == -1) PlotPoint(i, rsxDa, rsxDb, rsx);
    }
}

//-------------------------------------------------------------------
// Function to clean previous points
//-------------------------------------------------------------------
void CleanPoint(int i, double& first[], double& second[])
{
    if ((second[i] != EMPTY_VALUE) && (second[i + 1] != EMPTY_VALUE))
        second[i + 1] = EMPTY_VALUE;
    else if ((first[i] != EMPTY_VALUE) && (first[i + 1] != EMPTY_VALUE) && (first[i + 2] == EMPTY_VALUE))
        first[i + 1] = EMPTY_VALUE;
}

//-------------------------------------------------------------------
// Function to plot points
//-------------------------------------------------------------------
void PlotPoint(int i, double& first[], double& second[], double& from[])
{
    if (first[i + 1] == EMPTY_VALUE)
    {
        if (first[i + 2] == EMPTY_VALUE)
        {
            first[i] = from[i];
            first[i + 1] = from[i + 1];
            second[i] = EMPTY_VALUE;
        }
        else
        {
            second[i] = from[i];
            second[i + 1] = from[i + 1];
            first[i] = EMPTY_VALUE;
        }
    }
    else
    {
        first[i] = from[i];
        second[i] = EMPTY_VALUE;
    }
}
What is the RSX Indicator?
The RSX (Relative Strength Index X) indicator is a variation of the well-known Relative Strength Index (RSI). It is designed to measure the momentum of an asset, helping traders assess whether it is overbought or oversold. The RSX indicator, like the RSI, is used to gauge the strength of a trend and potential reversal points.
Key Components of the RSX Indicator
Indicator Buffers
The RSX indicator relies on several key components:
- RSX Values: These are the primary values calculated by the indicator, which reflect the relative strength of the asset.
- RSX Da Values: These values represent specific points on the RSX curve, which can be used to identify certain trading signals.
- RSX Db Values: Similar to RSX Da values, these points also help in identifying trading signals.
- Slope Values: The slope values indicate the direction of the trend, showing whether the momentum is increasing or decreasing.
Calculation Parameters
The RSX indicator uses two main parameters:
- Length: This parameter defines the period over which the RSX values are calculated. It determines how many past data points are used in the calculation.
- Price: This parameter specifies which price type (e.g., closing price) is used for the calculations.
How Does the RSX Indicator Work?
Initialization
When the RSX indicator is initialized, it sets up several buffers that are essential for storing and displaying the calculated values. These buffers are linked to the indicator’s data series, allowing the indicator to update its values as new market data becomes available.
Main Calculation
The core of the RSX indicator’s functionality lies in its calculation process:
- Data Smoothing: The indicator starts by smoothing the price data using a moving average. This helps to reduce noise and makes the trend clearer.
- Momentum Calculation: It then calculates the momentum of the asset by comparing the current value with previous values.
- RSX Value Calculation: The indicator calculates the RSX values based on the momentum and smoothing factors. These values reflect the strength of the asset’s trend.
Plotting and Interpretation
Once the RSX values are calculated, they are plotted on the chart. The indicator also calculates additional values (RSX Da and RSX Db) to help identify potential trading signals. These signals can indicate when the asset might be overbought or oversold, helping traders make informed decisions.
Practical Use of the RSX Indicator
The RSX indicator can be used in various ways:
- Trend Analysis: By observing the RSX values and slope, traders can determine the overall trend direction.
- Signal Identification: The RSX Da and RSX Db values can help traders spot potential buy or sell signals based on the asset’s momentum and strength.
Conclusion
The RSX indicator is a valuable tool for traders looking to analyze market trends and make informed decisions. By understanding its components and calculation process, you can better utilize the indicator to assess the strength of an asset’s trend and identify potential trading opportunities. Remember, like all technical indicators, the RSX should be used in conjunction with other analysis methods to enhance your trading strategy.