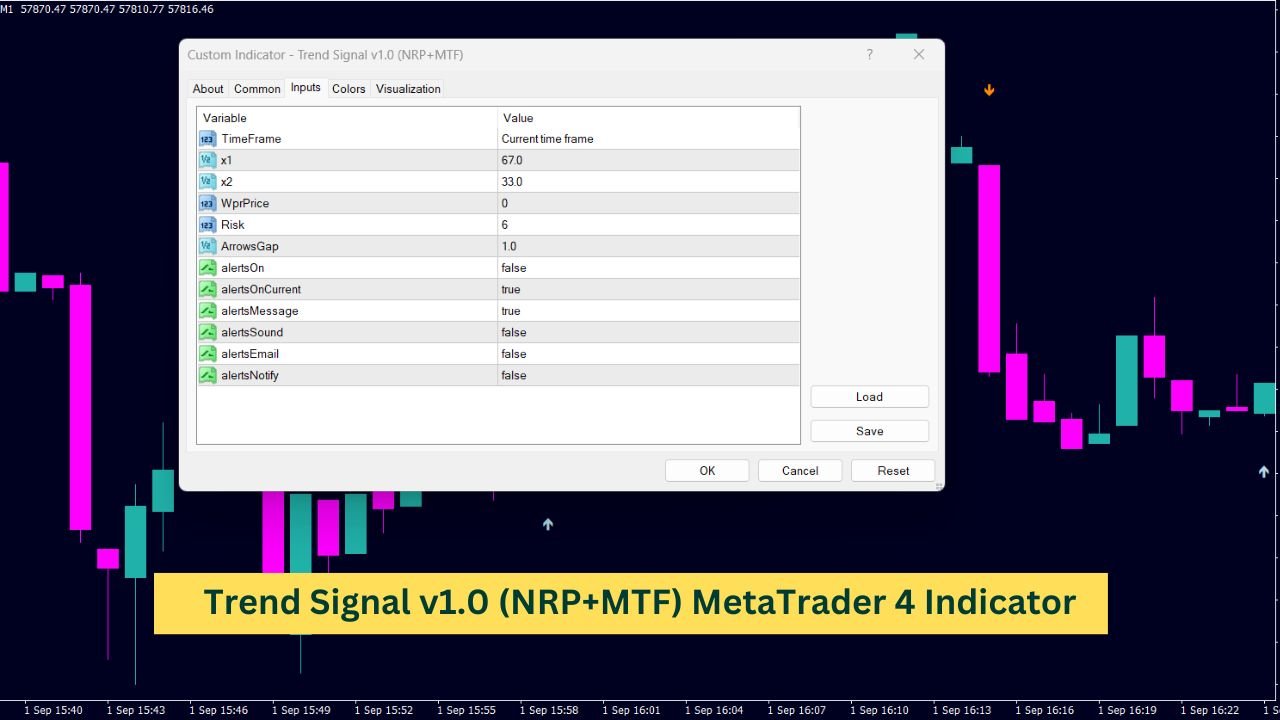
The Trend Signal v1.0 (NRP+MTF) is a custom indicator designed for analyzing market trends. It features non-repainting (NRP) functionality, ensuring that past signals remain accurate, and multi-timeframe (MTF) capability, allowing it to operate across different time frames. This indicator generates visual signals on the chart, such as arrows, based on price action and market volatility. It offers customization options for risk settings and alerts, providing a flexible tool for traders looking to analyze market trends in various time frames.
//--- Indicator properties
#property indicator_chart_window
#property indicator_buffers 2
#property indicator_color1 DarkOrange
#property indicator_color2 LightBlue
#property indicator_width1 1
#property indicator_width2 1

//--- Enumeration for TimeFrames
enum enTimeFrames
{
   tf_cu  = PERIOD_CURRENT, // Current time frame
   tf_m1  = PERIOD_M1,      // 1 minute
   tf_m5  = PERIOD_M5,      // 5 minutes
   tf_m15 = PERIOD_M15,     // 15 minutes
   tf_m30 = PERIOD_M30,     // 30 minutes
   tf_h1  = PERIOD_H1,      // 1 hour
   tf_h4  = PERIOD_H4,      // 4 hours
   tf_d1  = PERIOD_D1,      // Daily
   tf_w1  = PERIOD_W1,      // Weekly
   tf_mn1 = PERIOD_MN1,     // Monthly
   tf_n1  = -1,             // First higher time frame
   tf_n2  = -2,             // Second higher time frame
   tf_n3  = -3              // Third higher time frame
};

//--- Input parameters
extern enTimeFrames TimeFrame = tf_cu;   // Time frame
extern double x1 = 67;
extern double x2 = 33;
extern int WprPrice = 0;
extern int Risk = 6;
extern double ArrowsGap = 1.0;

extern bool alertsOn = false;
extern bool alertsOnCurrent = true;
extern bool alertsMessage = true;
extern bool alertsSound = false;
extern bool alertsEmail = false;
extern bool alertsNotify = false;

//--- Buffers
double arrDn[];          // Buffer for downward arrows
double arrUp[];          // Buffer for upward arrows
double wpr[];            // Buffer for WPR values
double price[];          // Buffer for price values
string indicatorFileName; // Name of the indicator file
bool returnBars;         // Flag to determine if bars are returned

//+------------------------------------------------------------------+
//| Custom indicator initialization function                         |
//+------------------------------------------------------------------+
int init()
{
   IndicatorBuffers(4);   // Set the number of indicator buffers
   //--- Initialize buffers and styles
   SetIndexBuffer(0, arrDn);
   SetIndexStyle(0, DRAW_ARROW);
   SetIndexArrow(0, 234);

   SetIndexBuffer(1, arrUp);
   SetIndexStyle(1, DRAW_ARROW);
   SetIndexArrow(1, 233);

   SetIndexBuffer(2, wpr);
   SetIndexBuffer(3, price);

   indicatorFileName = WindowExpertName(); // Get the name of the indicator
   returnBars = TimeFrame == -99;          // Check if returnBars is set
   TimeFrame = (enTimeFrames)timeFrameValue(TimeFrame); // Get the correct time frame

   return (0);
}

//+------------------------------------------------------------------+
//| Custom indicator iteration function                              |
//+------------------------------------------------------------------+
int start()
{
   int counted_bars = IndicatorCounted();  // Get the number of counted bars
   if (counted_bars < 0) return (-1);      // Error handling
   if (counted_bars > 0) counted_bars--;   // Adjust counted bars

   int limit = MathMin(Bars - counted_bars, Bars - 1); // Set limit for calculations

   if (returnBars)
   {
      arrDn[0] = limit + 1;
      return (0);
   }

   //--- Adjust for different time frames
   if (TimeFrame != Period())
   {
      limit = (int)MathMax(limit, MathMin(Bars - 1, iCustom(NULL, TimeFrame, indicatorFileName, -99, 0, 0) * TimeFrame / Period()));
      for (int i = limit; i >= 0; i--)
      {
         int y = iBarShift(NULL, TimeFrame, Time[i]);
         int x = iBarShift(NULL, TimeFrame, Time[i + 1]);

         if (y != x)
         {
            arrDn[i] = iCustom(NULL, TimeFrame, indicatorFileName, PERIOD_CURRENT, x1, x2, WprPrice, Risk, ArrowsGap, alertsOn, alertsOnCurrent, alertsMessage, alertsSound, alertsEmail, alertsNotify, 0, y);
            arrUp[i] = iCustom(NULL, TimeFrame, indicatorFileName, PERIOD_CURRENT, x1, x2, WprPrice, Risk, ArrowsGap, alertsOn, alertsOnCurrent, alertsMessage, alertsSound, alertsEmail, alertsNotify, 1, y);
         }
         else
         {
            arrDn[i] = EMPTY_VALUE;
            arrUp[i] = EMPTY_VALUE;
         }
      }
      return (0);
   }

   //--- Main loop for indicator calculations
   for (i = limit; i >= 0; i--)
   {
      int period = 3 + Risk * 2;
      double range = 0;
      for (int k = 0; k < 10; k++)
         range += High[i + k] - Low[i + k];
      range /= 10.0;

      bool found1 = false;
      for (k = 0; k < 6 && !found1; k++)
         found1 = (MathAbs(Open[i + k] - Close[i + k + 1]) >= range * 2.0);

      bool found2 = false;
      for (k = 0; k < 9 && !found2; k++)
         found2 = (MathAbs(Close[i + k + 3] - Close[i + k]) >= range * 4.6);

      if (found1) period = 3;
      if (found2) period = 4;

      price[i] = getPrice(WprPrice, i); // Calculate price
      double hi = High[iHighest(NULL, 0, MODE_HIGH, period, i)];
      double lo = Low[iLowest(NULL, 0, MODE_LOW, period, i)];

      if (hi != lo)
         wpr[i] = 100 + (-100) * (hi - price[i]) / (hi - lo);
      else
         wpr[i] = 0;

      //--- Assign values to buffers based on WPR
      arrDn[i] = EMPTY_VALUE;
      arrUp[i] = EMPTY_VALUE;

      if (wpr[i] < x2 - Risk)
      {
         for (k = 1; i + k < Bars && wpr[i + k] >= x2 - Risk && wpr[i + k] <= x1 + Risk;)
            k++;
         if (wpr[i + k] > x1 + Risk)
            arrDn[i] = High[i] + range * ArrowsGap;
      }

      if (wpr[i] > x1 + Risk)
      {
         for (k = 1; i + k < Bars && wpr[i + k] >= x2 - Risk && wpr[i + k] <= x1 + Risk;)
            k++;
         if (wpr[i + k] < x2 - Risk)
            arrUp[i] = Low[i] - range * ArrowsGap;
      }
   }

   manageAlerts(); // Manage alerts
   return (0);
}

//+------------------------------------------------------------------+
//| Manage alerts based on indicator conditions                      |
//+------------------------------------------------------------------+
void manageAlerts()
{
   if (alertsOn)
   {
      int whichBar = alertsOnCurrent ? 0 : 1;

      if (arrDn[whichBar] != EMPTY_VALUE || arrUp[whichBar] != EMPTY_VALUE)
      {
         if (arrUp[whichBar] != EMPTY_VALUE)
            doAlert(whichBar, "up");
         if (arrDn[whichBar] != EMPTY_VALUE)
            doAlert(whichBar, "down");
      }
   }
}

//+------------------------------------------------------------------+
//| Trigger alerts                                                   |
//+------------------------------------------------------------------+
void doAlert(int forBar, string doWhat)
{
   static string previousAlert = "nothing";
   static datetime previousTime;
   string message;

   if (previousAlert != doWhat || previousTime != Time[forBar])
   {
      previousAlert = doWhat;
      previousTime = Time[forBar];

      //--- Prepare alert message
      message = StringConcatenate(Symbol(), " at ", TimeToStr(TimeLocal(), TIME_SECONDS), " Trend signal trend changed to ", doWhat);

      //--- Trigger various alert types
      if (alertsMessage)
         Alert(message);
      if (alertsNotify)
         SendNotification(message);
      if (alertsEmail)
         SendMail(StringConcatenate(Symbol(), " Trend Signal"), message);
      if (alertsSound)
         PlaySound("alert2.wav");
   }
}

//+------------------------------------------------------------------+
//| Calculate price based on type                                    |
//+------------------------------------------------------------------+
double getPrice(int type, int i)
{
   switch (type)
   {
      case 7:
         return ((Open[i] + Close[i]) / 2.0);
      case 8:
         return ((Open[i] + High[i] + Low[i] + Close[i]) / 4.0);
      default:
         return (iMA(NULL, 0, 1, 0, MODE_SMA, type, i));
   }
}

//--- Time frame conversion arrays
string sTfTable[] = {"M1", "M5", "M15", "M30", "H1", "H4", "D1", "W1", "MN"}; // String representation of time frames
int iTfTable[] = {1, 5, 15, 30, 60, 240, 1440, 10080, 43200};                 // Corresponding integer values of time frames

//+------------------------------------------------------------------+
//| Convert time frame integer to string representation              |
//+------------------------------------------------------------------+
string timeFrameToString(int tf)
{
   for (int i = ArraySize(iTfTable) - 1; i >= 0; i--)
   {
      if (tf == iTfTable[i])
         return (sTfTable[i]); // Return the string representation of the time frame
   }
   return (""); // Return an empty string if no match is found
}

//+------------------------------------------------------------------+
//| Get time frame value with adjustment for higher time frames      |
//+------------------------------------------------------------------+
int timeFrameValue(int _tf)
{
   int add = (_tf >= 0) ? 0 : MathAbs(_tf); // Determine if an adjustment is needed
   if (add != 0) _tf = _Period;             // Use current period if adjustment is needed

   int size = ArraySize(iTfTable);          // Get the size of the time frame array
   int i = 0;

   for (; i < size; i++)
   {
      if (iTfTable[i] == _tf)
         break; // Find the matching time frame in the array
   }

   if (i == size) return (_Period); // Return the current period if no match is found
   return (iTfTable[(int)MathMin(i + add, size - 1)]); // Return the adjusted time frame
}

//+------------------------------------------------------------------+
//| End of the indicator code                                        |
//+------------------------------------------------------------------+
What Does This Indicator Do?
This indicator is designed to identify potential market trends by analyzing price movements across different time frames. The indicator draws arrows on the chart to signal when the price might move up or down. These signals are based on a calculation that takes into account various factors such as price action, market volatility, and specific user-defined settings.
How the Indicator Works
Time Frame Selection
One of the first things this indicator does is determine which time frame it should analyze. You can set the time frame manually, or let the indicator adjust it dynamically to higher time frames.
- Current Time Frame: The indicator can work on the current time frame that you’re viewing on the chart.
- Higher Time Frames: Alternatively, it can calculate signals based on higher time frames, which is helpful for identifying larger trends.
This flexibility allows you to tailor the indicator to your preferred trading style, whether you’re a scalper or a swing trader.
Price Analysis
The core of the indicator is its ability to analyze price action. It considers the highest and lowest points within a certain period and calculates a value known as Williams’ Percent Range (WPR). This WPR value is a crucial part of the indicator’s decision-making process.
- Highs and Lows: The indicator checks for the highest high and lowest low over a specific period.
- Williams’ Percent Range (WPR): It then calculates how far the current price is from these highs and lows, giving a percentage that reflects whether the price is near the top or bottom of its range.
Generating Signals
Now comes the part that traders are most interested in—signals. The indicator uses the WPR value to determine when to draw arrows on the chart, indicating potential buy or sell opportunities.
- Down Arrows: When the WPR value suggests that the price is likely to move down, the indicator draws a down arrow above the current price.
- Up Arrows: Conversely, when the WPR value suggests that the price might move up, the indicator draws an up arrow below the current price.
These arrows serve as visual cues, helping you quickly spot potential trading opportunities without needing to perform complex analysis yourself.
Customization Options
One of the strengths of this indicator is the range of customization options it offers. You can tweak various settings to better fit your trading strategy.
Risk Settings
You can adjust the Risk parameter to make the indicator more or less sensitive to price movements.
- Higher Risk: A higher risk setting will make the indicator more aggressive, generating more signals but potentially increasing false positives.
- Lower Risk: A lower risk setting makes the indicator more conservative, generating fewer but potentially more reliable signals.
Alerts
The indicator also includes an alerts feature, which can notify you when a signal is generated. This is incredibly useful if you want to keep an eye on the market without constantly watching the screen.
- On-Screen Alerts: These appear directly on your chart.
- Sound Alerts: Play a sound when a new signal is generated.
- Email Notifications: Send an email whenever a new signal occurs, so you can stay informed even when you’re away from your trading platform.
Time Frame Adjustments
If you prefer, you can let the indicator adjust the time frame dynamically, moving to higher time frames to identify bigger trends. This feature is particularly useful if you’re not just interested in quick, short-term trades but also want to capture longer-term trends.
Managing Alerts
The indicator also comes with a built-in function to manage alerts, ensuring you get notified at the right times. You can decide whether to receive alerts based on the current bar (the most recent data) or the previous one. This flexibility allows you to manage how early or late you get notified about a potential trading opportunity.
Understanding the Indicator’s Decision-Making Process
Analyzing Volatility
The indicator doesn’t just look at price levels; it also considers market volatility. It averages the range of highs and lows over several bars to get a sense of how volatile the market is. This volatility is then used to decide whether a significant price movement is likely.
Evaluating Price Patterns
The indicator checks for specific price patterns that might indicate a change in market direction. It looks for situations where the open price is significantly different from the close price over consecutive bars. If it finds a pattern that matches its criteria, it adjusts the time period it’s analyzing to make a more informed decision.
Calculating and Plotting WPR
Finally, the WPR is calculated by comparing the current price to the highest and lowest prices within the chosen period. Depending on the WPR value, the indicator then decides whether to plot an up or down arrow.
Conclusion
This indicator is a powerful tool for traders who want to identify potential market trends with ease. By analyzing price action, volatility, and time frames, it generates clear signals that can help you make more informed trading decisions. With its customizable settings and alert options, this indicator is adaptable to a wide range of trading styles and preferences.