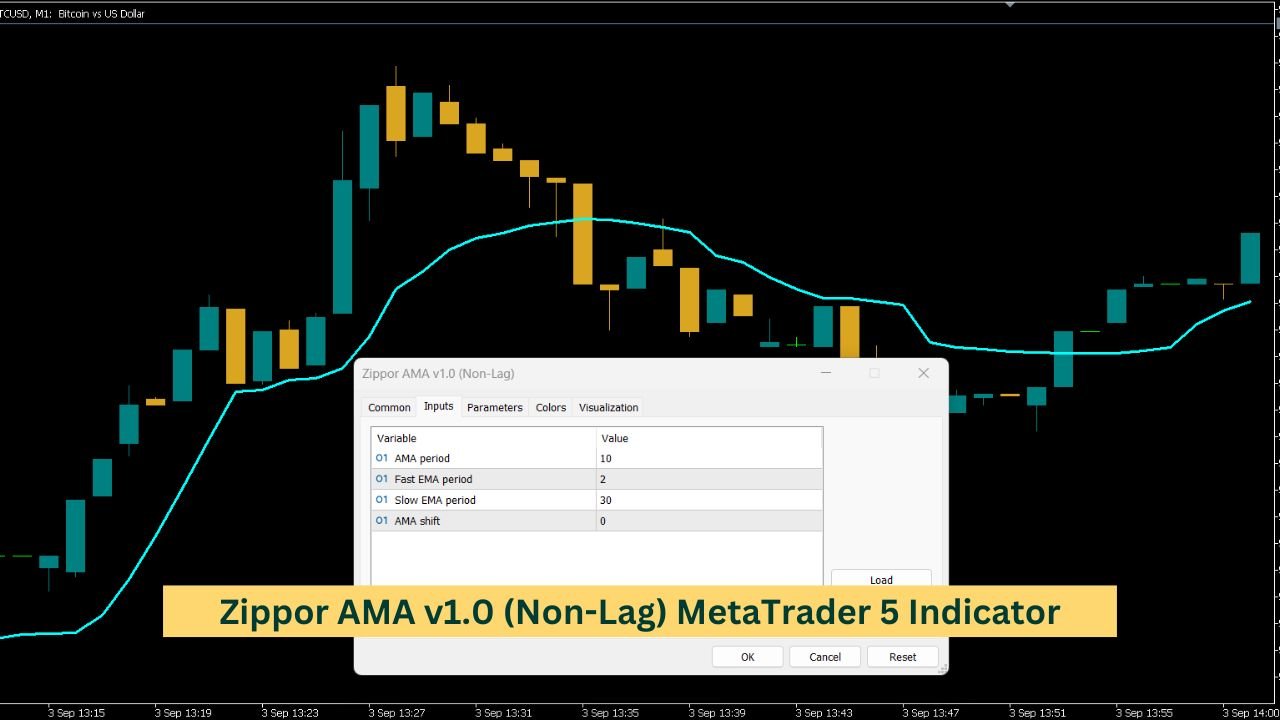
The Zippor AMA v1.0 (Non-Lag) is a trading indicator designed to offer a smoothed view of price trends. By utilizing the Adaptive Moving Average (AMA) concept, this indicator adjusts its sensitivity based on recent market movements. It aims to provide a balanced perspective on price trends without introducing lag. This allows traders to analyze market trends and make informed decisions based on a clear, adaptive signal.
#property indicator_chart_window
#property indicator_buffers 1
#property indicator_plots   1

//---- plot ExtAMABuffer
#property indicator_label1  "AMA"
#property indicator_type1   DRAW_LINE
#property indicator_color1  Red
#property indicator_style1  STYLE_SOLID
#property indicator_width1  1

//--- default applied price
#property indicator_applied_price PRICE_OPEN

//--- input parameters
input int InpPeriodAMA = 10;      // AMA period
input int InpFastPeriodEMA = 2;   // Fast EMA period
input int InpSlowPeriodEMA = 30;  // Slow EMA period
input int InpShiftAMA = 0;        // AMA shift

//--- indicator buffers
double ExtAMABuffer[];

//--- global variables
double ExtFastSC;
double ExtSlowSC;
int    ExtPeriodAMA;
int    ExtSlowPeriodEMA;
int    ExtFastPeriodEMA;

//+------------------------------------------------------------------+
//| AMA initialization function                                      |
//+------------------------------------------------------------------+
int OnInit()
{
    //--- check for input values and set defaults if necessary
    if (InpPeriodAMA <= 0)
    {
        ExtPeriodAMA = 10;
        Print("Input parameter InpPeriodAMA has incorrect value (", InpPeriodAMA, "). Indicator will use value ", ExtPeriodAMA, " for calculations.");
    }
    else
    {
        ExtPeriodAMA = InpPeriodAMA;
    }

    if (InpSlowPeriodEMA <= 0)
    {
        ExtSlowPeriodEMA = 30;
        Print("Input parameter InpSlowPeriodEMA has incorrect value (", InpSlowPeriodEMA, "). Indicator will use value ", ExtSlowPeriodEMA, " for calculations.");
    }
    else
    {
        ExtSlowPeriodEMA = InpSlowPeriodEMA;
    }

    if (InpFastPeriodEMA <= 0)
    {
        ExtFastPeriodEMA = 2;
        Print("Input parameter InpFastPeriodEMA has incorrect value (", InpFastPeriodEMA, "). Indicator will use value ", ExtFastPeriodEMA, " for calculations.");
    }
    else
    {
        ExtFastPeriodEMA = InpFastPeriodEMA;
    }

    //--- indicator buffers mapping
    SetIndexBuffer(0, ExtAMABuffer, INDICATOR_DATA);

    //--- set shortname and change label
    string short_name = "AMA(" + IntegerToString(ExtPeriodAMA) + "," +
                        IntegerToString(ExtFastPeriodEMA) + "," +
                        IntegerToString(ExtSlowPeriodEMA) + ")";
    IndicatorSetString(INDICATOR_SHORTNAME, short_name);
    PlotIndexSetString(0, PLOT_LABEL, short_name);

    //--- set accuracy
    IndicatorSetInteger(INDICATOR_DIGITS, _Digits + 1);

    //--- sets first bar from what index will be drawn
    PlotIndexSetInteger(0, PLOT_DRAW_BEGIN, ExtPeriodAMA);

    //--- set index shift
    PlotIndexSetInteger(0, PLOT_SHIFT, InpShiftAMA);

    //--- calculate ExtFastSC & ExtSlowSC
    ExtFastSC = 2.0 / (ExtFastPeriodEMA + 1.0);
    ExtSlowSC = 2.0 / (ExtSlowPeriodEMA + 1.0);

    //--- OnInit done
    return(INIT_SUCCEEDED);
}

//+------------------------------------------------------------------+
//| AMA calculation function                                        |
//+------------------------------------------------------------------+
int OnCalculate(const int rates_total,
                const int prev_calculated,
                const int begin,
                const double &price[])
{
    int i;

    //--- check for rates count
    if (rates_total < ExtPeriodAMA + begin)
    {
        return (0);
    }

    //--- draw begin may be corrected
    if (begin != 0)
    {
        PlotIndexSetInteger(0, PLOT_DRAW_BEGIN, ExtPeriodAMA + begin);
    }

    //--- detect position
    int pos = prev_calculated - 1;

    //--- first calculations
    if (pos < ExtPeriodAMA + begin)
    {
        pos = ExtPeriodAMA + begin;
        for (i = 0; i < pos - 1; i++)
        {
            ExtAMABuffer[i] = 0.0;
        }
        ExtAMABuffer[pos - 1] = price[pos - 1];
    }

    //--- main calculation loop
    for (i = pos; i < rates_total && !IsStopped(); i++)
    {
        //--- calculate SSC
        double dCurrentSSC = (CalculateER(i, price) * (ExtFastSC - ExtSlowSC)) + ExtSlowSC;

        //--- calculate AMA
        double dPrevAMA = ExtAMABuffer[i - 1];
        ExtAMABuffer[i] = pow(dCurrentSSC, 2) * (price[i] - dPrevAMA) + dPrevAMA;
    }

    //--- return value of prev_calculated for next call
    return (rates_total);
}

//+------------------------------------------------------------------+
//| Calculate ER value                                               |
//+------------------------------------------------------------------+
double CalculateER(const int nPosition, const double &PriceData[])
{
    double dSignal = fabs(PriceData[nPosition] - PriceData[nPosition - ExtPeriodAMA]);
    double dNoise = 0.0;

    //--- calculate noise
    for (int delta = 0; delta < ExtPeriodAMA; delta++)
    {
        dNoise += fabs(PriceData[nPosition - delta] - PriceData[nPosition - delta - 1]);
    }

    //--- return ER value
    if (dNoise != 0.0)
    {
        return (dSignal / dNoise);
    }

    return (0.0);
}
What is the AMA Indicator?
The AMA indicator is designed to help traders identify trends and potential entry or exit points by smoothing price data. It adapts to market conditions by adjusting its sensitivity based on recent price movements. This adaptability helps it stay responsive during volatile periods and more stable during calm market conditions.
How Does the AMA Indicator Work?
The AMA indicator utilizes a combination of Exponential Moving Averages (EMAs) and a unique Efficiency Ratio (ER) to calculate its value. Here’s a simplified breakdown of its components and how they come together:
Input Parameters
- AMA Period (InpPeriodAMA): This parameter determines the number of periods over which the AMA is calculated. A shorter period makes the indicator more sensitive to price changes, while a longer period smooths out the fluctuations.
- Fast EMA Period (InpFastPeriodEMA): This is the period used for the fast EMA, which responds more quickly to price changes.
- Slow EMA Period (InpSlowPeriodEMA): This period is used for the slow EMA, which reacts more slowly to price movements.
- AMA Shift (InpShiftAMA): This parameter allows you to shift the AMA line on the chart, helping you align it better with your analysis.
Initialization
When the indicator is first applied, it performs a series of checks to ensure that the input parameters are valid. If any parameter is found to be incorrect, it defaults to a standard value and notifies the user. This ensures that the indicator operates smoothly and consistently.
Calculation Process
- Buffer Initialization: The indicator sets up a buffer to store the calculated values of the AMA. Initially, this buffer is filled with zeros.
- Efficiency Ratio Calculation: The AMA uses the Efficiency Ratio (ER) to determine how effectively the price is moving compared to its recent movements. The ER is calculated by comparing the current price to the price from a specified number of periods ago, then adjusting for the total price changes over those periods.
- AMA Calculation: Using the ER, the indicator calculates the AMA value. It does this by applying a formula that incorporates the current ER, the difference between the current price and the previous AMA value, and the previous AMA value itself.
- Plotting the AMA: Finally, the AMA values are plotted on the chart. The indicator displays a line that represents the AMA, helping traders visualize the trend and make informed decisions.
Key Features of the AMA Indicator
- Adaptive Sensitivity: The AMA adjusts its sensitivity based on recent price changes, making it adaptable to different market conditions.
- Trend Identification: By smoothing price data, the AMA helps traders identify the underlying trend, which can be useful for making trading decisions.
- Customizable Parameters: Traders can adjust the input parameters to fit their trading style and market conditions.
Conclusion
The AMA indicator is a versatile tool that adapts to changing market conditions, helping traders identify trends and potential trading opportunities. By understanding its components and how it calculates values, you can use the AMA to enhance your trading strategy. Remember, while the AMA indicator provides valuable insights, it’s essential to combine it with other analysis methods and tools to make well-rounded trading decisions.